Comcast 2010 Annual Report Download - page 83
Download and view the complete annual report
Please find page 83 of the 2010 Comcast annual report below. You can navigate through the pages in the report by either clicking on the pages listed below, or by using the keyword search tool below to find specific information within the annual report.-
 1
1 -
2
-
3
-
4
-
5
-
6
-
7
-
8
-
9
-
10
-
11
-
12
-
13
-
14
-
15
-
16
-
17
-
18
-
19
-
20
-
21
-
22
-
23
-
24
-
25
-
26
-
27
-
28
-
29
-
30
-
31
-
32
-
33
-
34
-
35
-
36
-
37
-
38
-
39
-
40
-
41
-
42
-
43
-
44
-
45
-
46
-
47
-
48
-
49
-
50
-
51
-
52
-
53
-
54
-
55
-
56
-
57
-
58
-
59
-
60
-
61
-
62
-
63
-
64
-
65
-
66
-
67
-
68
-
69
-
70
-
71
-
72
-
 73
73 -
 74
74 -
 75
75 -
 76
76 -
 77
77 -
 78
78 -
 79
79 -
 80
80 -
 81
81 -
 82
82 -
 83
83 -
 84
84 -
 85
85 -
 86
86 -
 87
87 -
 88
88 -
 89
89 -
 90
90 -
 91
91 -
 92
92 -
 93
93 -
94
-
95
-
96
-
97
-
98
-
99
-
100
-
101
-
102
-
103
-
104
-
105
-
106
-
107
-
108
-
109
-
110
-
111
-
112
-
113
-
114
-
115
-
116
-
117
-
118
-
119
-
120
-
121
-
122
-
123
-
124
-
125
-
126
-
127
-
128
-
129
-
130
-
131
-
132
-
133
-
134
-
135
-
136
-
137
-
138
-
139
-
140
-
141
-
142
-
143
-
144
-
145
-
146
-
147
-
148
-
149
-
150
-
151
-
152
-
153
-
154
-
155
-
156
-
157
-
158
-
159
-
160
-
161
-
162
-
163
-
164
-
165
-
166
-
167
-
168
-
169
-
170
-
171
-
172
-
173
-
174
-
175
-
176
-
177
-
178
-
179
-
180
-
181
-
182
-
183
-
184
-
185
-
186
-
187
-
188
-
189
-
190
-
191
-
192
-
193
-
194
-
195
-
196
-
197
-
198
-
199
-
200
-
201
-
202
-
203
-
204
-
205
-
206
-
207
-
208
-
209
-
210
-
211
-
212
-
213
-
214
-
215
-
216
-
217
-
218
-
219
-
220
-
221
-
222
-
223
-
224
-
225
-
226
-
227
-
228
-
229
-
230
-
231
-
232
-
233
-
234
-
235
-
236
-
237
-
238
-
239
-
240
-
241
-
242
-
243
-
244
-
245
-
246
-
247
-
248
-
249
-
250
-
251
-
252
-
253
-
254
-
255
-
256
-
257
-
258
-
259
-
260
-
261
-
262
-
263
-
264
-
265
-
266
-
267
-
268
-
269
-
270
-
271
-
272
-
273
-
274
-
275
-
276
-
277
-
278
-
279
-
280
-
281
-
282
-
283
-
284
-
285
-
286
-
287
-
288
-
289
-
290
-
291
-
292
-
293
-
294
-
295
-
296
-
297
-
298
-
299
-
300
-
301
-
302
-
303
-
304
-
305
-
306
-
307
-
308
-
309
-
310
-
311
-
312
-
313
-
314
-
315
-
316
-
317
-
318
-
319
-
320
-
321
-
322
-
323
-
324
-
325
-
326
-
327
-
328
-
329
-
330
-
331
-
332
-
333
-
334
-
335
-
336
-
337
-
338
-
339
-
340
-
341
-
342
-
343
-
344
-
345
-
346
-
347
-
348
-
349
-
350
-
351
 |
 |

Table of Contents
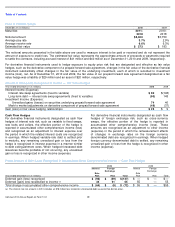
Interest rate risk deferred losses relate to interest rate lock and collar agreements entered into to fix the interest rates of certain of
our debt obligations in advance of their issuance. Unless we retire this debt early, these unrealized losses will be reclassified as an
adjustment to interest expense, primarily through 2022, in the period in which the related interest expense is recognized in
earnings. As of December 31, 2010, we expect $23 million of unrealized losses, $15 million net of deferred taxes, to be reclassified
as an adjustment to interest expense over the next 12 months. The foreign exchange risk deferred losses in 2010 relates to cross-
currency swaps on foreign currency denominated debt due in 2029. Ineffectiveness related to our cash flow hedges was not
material for 2010 or 2009.
See Note 14 for the components of accumulated other comprehensive income (loss).
Nondesignated
In 2010, 2009 and 2008, certain derivative financial instruments relating to equity price risk and interest rate risk were not
designated as fair value or cash flow hedges. Changes in fair value for these instruments are recognized on a current basis in
earnings.
Equity derivative financial instruments embedded in other contracts, such as our ZONES debt, are separated from their host
contract. The derivative component is recorded at its estimated fair value in our consolidated balance sheet and changes in its
value are recorded each period to investment income (loss), net.
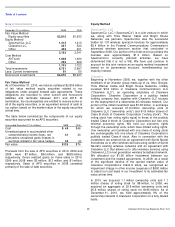
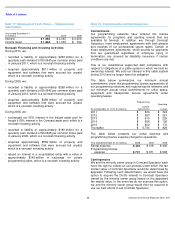
Amount of Gain (Loss) Recognized in Income
— Nondesignated
Year ended December 31 (in millions)
2010
2009
Investment Income (Expense):
Unrealized gains (losses) on securities underlying prepaid forward sale agreements
$
800
$
951
Mark to market adjustments on derivative component of prepaid forward sale agreements
(623
)
(778
)
Mark to market adjustments on derivative component of ZONES
7
8
Other Income (Expense):
Mark to market adjustments on interest rate collars
15
—
Total gain (loss)
$
199
$
181
73
Comcast 2010 Annual Report on Form 10-
K
Note 11: Fair Value Measurements
The accounting guidance related to financial assets and
financial liabilities (“financial instruments”) establishes a
hierarchy that prioritizes fair value measurements based on
the types of inputs used for the various valuation techniques
(market approach, income approach and cost approach). The
levels of the hierarchy are described below:
•
Level 1: consists of financial instruments whose values are
based on quoted market prices for identical financial
instruments in an active market
•
Level 2: consists of financial instruments that are valued
using models or other valuation methodologies. These
models use inputs that are observable either directly or
indirectly; Level 2 inputs include (i) quoted prices for similar
assets or liabilities in active markets, (ii) quoted prices for
identical or similar assets or liabilities in markets that are
not active, (iii) pricing models whose inputs are observable
for substantially the full term of the financial
Our assessment of the significance of a particular input to the
fair value measurement requires judgment and may affect the
valuation of financial instruments and their classification
within the fair value hierarchy. Financial instruments are
classified in their entirety based on the lowest level of input
that is significant to the fair value measurement. There have
been no changes in the classification of any financial
instruments within the fair value hierarchy in the periods
presented. Our financial instruments that are accounted for at
fair value on a recurring basis are presented in the table
below.
instrument and (iv) pricing models whose inputs are
derived principally from or corroborated by observable
market data through correlation or other means for
substantially the full term of the financial instrument
•
Level 3: consists of financial instruments whose values are
determined using pricing models that use significant inputs
that are primarily unobservable, discounted cash flow
methodologies, or similar techniques, as well as
instruments for which the determination of fair value
requires significant management judgment or estimation