Comcast 2010 Annual Report Download - page 76
Download and view the complete annual report
Please find page 76 of the 2010 Comcast annual report below. You can navigate through the pages in the report by either clicking on the pages listed below, or by using the keyword search tool below to find specific information within the annual report.-
 1
1 -
2
-
3
-
4
-
5
-
6
-
7
-
8
-
9
-
10
-
11
-
12
-
13
-
14
-
15
-
16
-
17
-
18
-
19
-
20
-
21
-
22
-
23
-
24
-
25
-
26
-
27
-
28
-
29
-
30
-
31
-
32
-
33
-
34
-
35
-
36
-
37
-
38
-
39
-
40
-
41
-
42
-
43
-
44
-
45
-
46
-
47
-
48
-
49
-
50
-
51
-
52
-
53
-
54
-
55
-
56
-
57
-
58
-
59
-
60
-
61
-
62
-
63
-
64
-
65
-
 66
66 -
 67
67 -
 68
68 -
 69
69 -
 70
70 -
 71
71 -
 72
72 -
 73
73 -
 74
74 -
 75
75 -
 76
76 -
 77
77 -
 78
78 -
 79
79 -
 80
80 -
 81
81 -
 82
82 -
 83
83 -
 84
84 -
 85
85 -
 86
86 -
87
-
88
-
89
-
90
-
91
-
92
-
93
-
94
-
95
-
96
-
97
-
98
-
99
-
100
-
101
-
102
-
103
-
104
-
105
-
106
-
107
-
108
-
109
-
110
-
111
-
112
-
113
-
114
-
115
-
116
-
117
-
118
-
119
-
120
-
121
-
122
-
123
-
124
-
125
-
126
-
127
-
128
-
129
-
130
-
131
-
132
-
133
-
134
-
135
-
136
-
137
-
138
-
139
-
140
-
141
-
142
-
143
-
144
-
145
-
146
-
147
-
148
-
149
-
150
-
151
-
152
-
153
-
154
-
155
-
156
-
157
-
158
-
159
-
160
-
161
-
162
-
163
-
164
-
165
-
166
-
167
-
168
-
169
-
170
-
171
-
172
-
173
-
174
-
175
-
176
-
177
-
178
-
179
-
180
-
181
-
182
-
183
-
184
-
185
-
186
-
187
-
188
-
189
-
190
-
191
-
192
-
193
-
194
-
195
-
196
-
197
-
198
-
199
-
200
-
201
-
202
-
203
-
204
-
205
-
206
-
207
-
208
-
209
-
210
-
211
-
212
-
213
-
214
-
215
-
216
-
217
-
218
-
219
-
220
-
221
-
222
-
223
-
224
-
225
-
226
-
227
-
228
-
229
-
230
-
231
-
232
-
233
-
234
-
235
-
236
-
237
-
238
-
239
-
240
-
241
-
242
-
243
-
244
-
245
-
246
-
247
-
248
-
249
-
250
-
251
-
252
-
253
-
254
-
255
-
256
-
257
-
258
-
259
-
260
-
261
-
262
-
263
-
264
-
265
-
266
-
267
-
268
-
269
-
270
-
271
-
272
-
273
-
274
-
275
-
276
-
277
-
278
-
279
-
280
-
281
-
282
-
283
-
284
-
285
-
286
-
287
-
288
-
289
-
290
-
291
-
292
-
293
-
294
-
295
-
296
-
297
-
298
-
299
-
300
-
301
-
302
-
303
-
304
-
305
-
306
-
307
-
308
-
309
-
310
-
311
-
312
-
313
-
314
-
315
-
316
-
317
-
318
-
319
-
320
-
321
-
322
-
323
-
324
-
325
-
326
-
327
-
328
-
329
-
330
-
331
-
332
-
333
-
334
-
335
-
336
-
337
-
338
-
339
-
340
-
341
-
342
-
343
-
344
-
345
-
346
-
347
-
348
-
349
-
350
-
351
 |
 |

Table of Contents
67
Comcast 2010 Annual Report on Form 10-
K
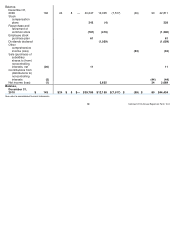
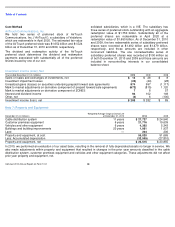
Note 6: Investments
Fair Value Method
As of December 31, 2010, we held as collateral $2.804 billion
of fair value method equity securities related to our
obligations under prepaid forward sale agreements. These
obligations are recorded to other current and noncurrent
liabilities and terminate between 2011 and 2015. At
termination, the counterparties are entitled to receive some or
all of the equity securities, or an equivalent amount of cash at
our option, based on the market value of the equity securities
at that time.
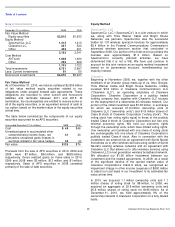
The table below summarizes the components of our equity
securities accounted for as AFS securities.
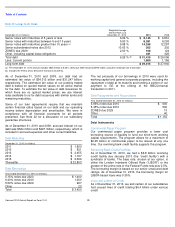
Proceeds from the sale of AFS securities in 2010, 2009 and
2008 were $7 million, $90 million and $638 million,
respectively. Gross realized gains on these sales in 2010,
2009 and 2008 were $3 million, $13 million and $1 million,
respectively. Sales of AFS securities in 2008 consisted
primarily of the sale of debt securities.
December 31 (in millions)
2010
2009
Fair Value Method
Equity securities
$
2,815
$
1,933
Equity Method
SpectrumCo, LLC
1,413
1,410
Clearwire LLC
357
530
Other
423
401
2,193
2,341
Cost Method
AirTouch
1,508
1,494
Other
235
229
1,743
1,723
Total investments
6,751
5,997
Less: Current investments
81
50
Noncurrent investments
$
6,670
$
5,947
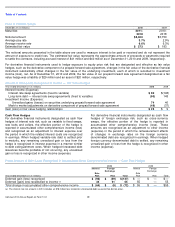
Year ended December 31 (in millions)
2010
2009
Cost
$
49
$
46
Unrealized gains in accumulated other
comprehensive income (loss), net
41
34
Cumulative unrealized gains (losses) in
earnings related to fair value hedges
36
(4
)
Fair value
$
126
$
76
Equity Method
SpectrumCo, LLC
SpectrumCo, LLC (“SpectrumCo”) is a joint venture in which
we, along with Time Warner Cable and Bright House
Networks, are partners. SpectrumCo was the successful
bidder for 137 wireless spectrum licenses for approximately
$2.4 billion in the Federal Communications Commission’s
advanced wireless spectrum auction that concluded in
September 2006. Our portion of the total cost to purchase the
licenses was approximately $1.3 billion. Based on
SpectrumCo’s currently planned activities, we have
determined that it is not a VIE. We have and continue to
account for this joint venture as an equity method investment
based on its governance structure, notwithstanding our
majority interest.
Clearwire
Beginning in November 2008, we, together with the other
members of an investor group made up of us, Intel, Google,
Time Warner Cable and Bright House Networks, initially
invested $3.2 billion in Clearwire Communications LLC
(“Clearwire LLC”), an operating subsidiary of Clearwire
Corporation. Clearwire Corporation is a publicly traded
holding company that, together with Clearwire LLC focuses
on the deployment of a nationwide 4G wireless network. Our
portion of the initial investment was $1.05 billion, in exchange
for which we received 61.8 million ownership units of
Clearwire LLC (“ownership units”) and 61.8 million shares of
Class B stock of Clearwire Corporation (“voting stock”). The
voting stock has voting rights equal to those of the publicly
traded Class A stock of Clearwire Corporation but has only
minimal economic rights. We hold our economic rights
through the ownership units, which have limited voting rights.
One ownership unit combined with one share of voting stock
are exchangeable into one share of Clearwire Corporation’s
publicly traded Class A stock. Also in connection with the
investment, we entered into an agreement with Sprint Nextel
that allows us to offer wireless services using certain of Sprint
Nextel’s existing wireless networks and an agreement with
Clearwire LLC that allows us to offer wireless services using
Clearwire LLC’s next generation wireless broadband network.
We allocated our $1.05 billion investment between our
investment and the related agreements. In 2008, as a result
of the significant decline in the quoted market value of
Clearwire Corporation’s Class A stock, we recognized an
impairment charge in other income (expense) of $600 million
to adjust our cost basis in our investment to its estimated fair
value at that time.
In 2010, we acquired 1.1 million ownership units and 1.1
million shares of voting stock for $8 million. In 2009, we
acquired an aggregate of 25.6 million ownership units and
25.6 million shares of voting stock for $185 million. As of
December 31, 2010, we held approximately 9% of the
ownership interests in Clearwire Corporation on a fully diluted
basis.