Comcast 2010 Annual Report Download - page 51
Download and view the complete annual report
Please find page 51 of the 2010 Comcast annual report below. You can navigate through the pages in the report by either clicking on the pages listed below, or by using the keyword search tool below to find specific information within the annual report.-
 1
1 -
2
-
3
-
4
-
5
-
6
-
7
-
8
-
9
-
10
-
11
-
12
-
13
-
14
-
15
-
16
-
17
-
18
-
19
-
20
-
21
-
22
-
23
-
24
-
25
-
26
-
27
-
28
-
29
-
30
-
31
-
32
-
33
-
34
-
35
-
36
-
37
-
38
-
39
-
40
-
 41
41 -
 42
42 -
 43
43 -
 44
44 -
 45
45 -
 46
46 -
 47
47 -
 48
48 -
 49
49 -
 50
50 -
 51
51 -
 52
52 -
 53
53 -
 54
54 -
 55
55 -
 56
56 -
 57
57 -
 58
58 -
 59
59 -
 60
60 -
 61
61 -
62
-
63
-
64
-
65
-
66
-
67
-
68
-
69
-
70
-
71
-
72
-
73
-
74
-
75
-
76
-
77
-
78
-
79
-
80
-
81
-
82
-
83
-
84
-
85
-
86
-
87
-
88
-
89
-
90
-
91
-
92
-
93
-
94
-
95
-
96
-
97
-
98
-
99
-
100
-
101
-
102
-
103
-
104
-
105
-
106
-
107
-
108
-
109
-
110
-
111
-
112
-
113
-
114
-
115
-
116
-
117
-
118
-
119
-
120
-
121
-
122
-
123
-
124
-
125
-
126
-
127
-
128
-
129
-
130
-
131
-
132
-
133
-
134
-
135
-
136
-
137
-
138
-
139
-
140
-
141
-
142
-
143
-
144
-
145
-
146
-
147
-
148
-
149
-
150
-
151
-
152
-
153
-
154
-
155
-
156
-
157
-
158
-
159
-
160
-
161
-
162
-
163
-
164
-
165
-
166
-
167
-
168
-
169
-
170
-
171
-
172
-
173
-
174
-
175
-
176
-
177
-
178
-
179
-
180
-
181
-
182
-
183
-
184
-
185
-
186
-
187
-
188
-
189
-
190
-
191
-
192
-
193
-
194
-
195
-
196
-
197
-
198
-
199
-
200
-
201
-
202
-
203
-
204
-
205
-
206
-
207
-
208
-
209
-
210
-
211
-
212
-
213
-
214
-
215
-
216
-
217
-
218
-
219
-
220
-
221
-
222
-
223
-
224
-
225
-
226
-
227
-
228
-
229
-
230
-
231
-
232
-
233
-
234
-
235
-
236
-
237
-
238
-
239
-
240
-
241
-
242
-
243
-
244
-
245
-
246
-
247
-
248
-
249
-
250
-
251
-
252
-
253
-
254
-
255
-
256
-
257
-
258
-
259
-
260
-
261
-
262
-
263
-
264
-
265
-
266
-
267
-
268
-
269
-
270
-
271
-
272
-
273
-
274
-
275
-
276
-
277
-
278
-
279
-
280
-
281
-
282
-
283
-
284
-
285
-
286
-
287
-
288
-
289
-
290
-
291
-
292
-
293
-
294
-
295
-
296
-
297
-
298
-
299
-
300
-
301
-
302
-
303
-
304
-
305
-
306
-
307
-
308
-
309
-
310
-
311
-
312
-
313
-
314
-
315
-
316
-
317
-
318
-
319
-
320
-
321
-
322
-
323
-
324
-
325
-
326
-
327
-
328
-
329
-
330
-
331
-
332
-
333
-
334
-
335
-
336
-
337
-
338
-
339
-
340
-
341
-
342
-
343
-
344
-
345
-
346
-
347
-
348
-
349
-
350
-
351
 |
 |

Table of Contents
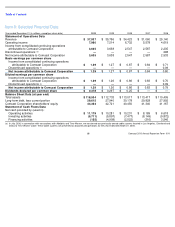
45
Comcast 2010 Annual Report on Form 10-
K
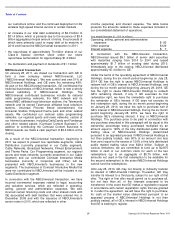
Investing Activities
Net cash used in investing activities consists primarily of cash
paid for capital expenditures, intangible assets, acquisitions
and investments.
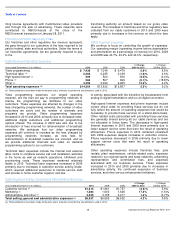
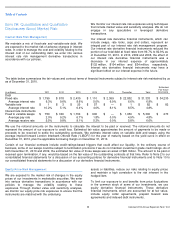
Capital Expenditures
Our most significant recurring investing activity has been
capital expenditures in our Cable segment, and we expect
that this will continue in the future. A significant portion of our
capital expenditures is based on the level of customer growth
and technologies being deployed. The table below
summarizes the capital expenditures we incurred in our
Cable segment from 2008 through 2010.
Cable capital expenditures decreased 3.8% and 9.2% in
2010 and 2009, respectively, primarily due to fewer
residential unit additions and improved equipment pricing,
partially offset by increased investment in our business
services and strategic initiatives such as our all digital
conversion and the continued deployment of DOCSIS 3.0
wideband technology.
Capital expenditures in our Programming segment were not
significant in 2010, 2009 or 2008. In 2008, our Corporate and
Other business activities included approximately $137 million
of capital expenditures related to the consolidation of offices
and the relocation of our corporate headquarters.
Capital expenditures for 2011 and for subsequent years will
depend on numerous factors, including acquisitions,
competition, changes in technology, regulatory changes and
the timing and rate of deployment of new services.
Acquisitions
On January 28, 2011, we closed the NBCUniversal
transaction (see Note 21 to our consolidated financial
statements). Our 2010 and 2009 acquisitions were not
significant. In 2008, acquisitions were primarily related to our
acquisition of an additional interest in Comcast SportsNet
Bay Area, our acquisition of the remaining interest in G4 that
we did not already own, and our acquisitions of Plaxo and
DailyCandy.
Year ended December 31 (in
millions)
2010
2009
2008
Customer premises
equipment
$
2,715
$
2,934
$
3,147
Scalable infrastructure
800
855
1,024
Line extensions
100
120
212
Support capital
373
421
522
Upgrades (capacity
expansion)
363
356
407
Business services
496
351
233
Total
$
4,847
$
5,037
$
5,545
Proceeds from Sales of Investments
In 2008, proceeds from the sales of investments were
primarily related to the disposition of available-for-sale debt
securities.
Purchases of Investments
In 2010, purchases of investments consisted primarily of the
purchase of an equity method investment in the Houston
Regional Sports Network. In 2009, purchases of investments
consisted primarily of our additional investment in Clearwire.
In 2008, purchases of investments consisted primarily of the
funding of our initial investment in Clearwire.
Financing Activities
Net cash used in financing activities consists primarily of
proceeds from borrowings, offset by our repurchases and
repayments of debt, repurchases of our common stock and
dividend payments. Proceeds from borrowings fluctuate from
year to year based on the amounts paid to fund acquisitions
and debt repayments.
We have made, and may from time to time in the future
make, optional repayments on our debt obligations, which
may include repurchases of our outstanding public notes and
debentures, depending on various factors, such as market
conditions. In 2009, we made $1.6 billion of optional
repurchases of our outstanding public bonds and ZONES
debt.
In July 2009, we completed a cash tender to repurchase
approximately $1.3 billion aggregate principal amount of
certain of our outstanding notes for approximately $1.5
billion. We recognized additional interest expense of
approximately $180 million primarily associated with the
premiums incurred in the tender offer. The premiums related
to the tender offer are included in other financing activities.
See Note 9 to our consolidated financial statements for
further discussion of our financing activities, including details
of our debt repayments and borrowings.
Share Repurchases and Dividends
In 2010, we repurchased approximately 70 million shares of
our Class A Special common stock under our share
repurchase authorization for approximately $1.2 billion. As of
December 31, 2010, we had approximately $2.1 billion of
availability remaining under our share repurchase
authorization. We intend to complete repurchases under the
current share repurchase authorization by the end of 2011,
subject to market conditions.