Classmates.com 2006 Annual Report Download - page 67
Download and view the complete annual report
Please find page 67 of the 2006 Classmates.com annual report below. You can navigate through the pages in the report by either clicking on the pages listed below, or by using the keyword search tool below to find specific information within the annual report.-
 1
1 -
2
-
3
-
4
-
5
-
6
-
7
-
8
-
9
-
10
-
11
-
12
-
13
-
14
-
15
-
16
-
17
-
18
-
19
-
20
-
21
-
22
-
23
-
24
-
25
-
26
-
27
-
28
-
29
-
30
-
31
-
32
-
33
-
34
-
35
-
36
-
37
-
38
-
39
-
40
-
41
-
42
-
43
-
44
-
45
-
46
-
47
-
48
-
49
-
50
-
51
-
52
-
53
-
54
-
55
-
56
-
 57
57 -
 58
58 -
 59
59 -
 60
60 -
 61
61 -
 62
62 -
 63
63 -
 64
64 -
 65
65 -
 66
66 -
 67
67 -
 68
68 -
 69
69 -
 70
70 -
 71
71 -
 72
72 -
 73
73 -
 74
74 -
 75
75 -
 76
76 -
 77
77 -
78
-
79
-
80
-
81
-
82
-
83
-
84
-
85
-
86
-
87
-
88
-
89
-
90
-
91
-
92
-
93
-
94
-
95
-
96
-
97
-
98
-
99
-
100
-
101
-
102
-
103
-
104
-
105
-
106
-
107
-
108
-
109
-
110
-
111
-
112
-
113
-
114
-
115
-
116
-
117
-
118
-
119
-
120
-
121
-
122
-
123
-
124
-
125
-
126
-
127
-
128
-
129
-
130
-
131
-
132
-
133
-
134
-
135
-
136
-
137
-
138
-
139
-
140
-
141
-
142
-
143
-
144
-
145
-
146
-
147
-
148
-
149
-
150
-
151
-
152
-
153
-
154
-
155
-
156
-
157
-
158
-
159
-
160
-
161
-
162
-
163
-
164
-
165
-
166
-
167
-
168
-
169
-
170
-
171
-
172
-
173
-
174
-
175
 |
 |

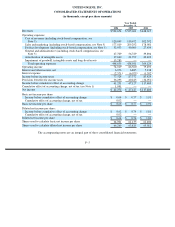
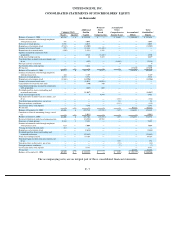
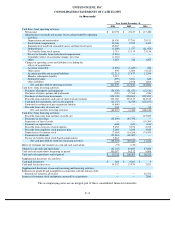
UNITED ONLINE, INC.
CONSOLIDATED STATEMENTS OF OPERATIONS
(in thousands, except per share amounts)
The accompanying notes are an integral part of these consolidated financial statements.
F- 5
Year Ended
December 31,
2006
2005
2004
Revenues
$
522,654
$
525,061
$
448,617
Operating expenses:
Cost of revenues (including stock-based compensation, see
Note 5)
120,049
110,672
102,392
Sales and marketing (including stock
-
based compensation, see Note 5)
177,019
209,292
178,981
Product development (including stock
-
based compensation, see Note 5)
52,933
40,009
27,454
General and administrative (including stock-based compensation, see
Note 5)
67,709
56,729
39,894
Amortization of intangible assets
17,640
21,799
20,403
Impairment of goodwill, intangible assets and long
-
lived assets
13,285
—
—
Total operating expenses
448,635
438,501
369,124
Operating income
74,019
86,560
79,493
Interest and other income, net
6,076
6,885
5,138
Interest expense
(2,571
)
(6,073
)
(1,202
)
Income before income taxes
77,524
87,372
83,429
Provision (benefit) for income taxes
36,293
40,245
(34,051
)
Income before cumulative effect of accounting change
41,231
47,127
117,480
Cumulative effect of accounting change, net of tax (see Note 1)
1,041
—
—
Net income
$
42,272
$
47,127
$
117,480
Basic net income per share:
Income before cumulative effect of accounting change
$
0.64
$
0.77
$
1.91
Cumulative effect of accounting change, net of tax
0.02
—
—
Basic net income per share
$
0.66
$
0.77
$
1.91
Diluted net income per share:
Income before cumulative effect of accounting change
$
0.62
$
0.74
$
1.81
Cumulative effect of accounting change, net of tax
0.02
—
—
Diluted net income per share
$
0.64
$
0.74
$
1.81
Shares used to calculate basic net income per share
64,001
61,135
61,404
Shares used to calculate diluted net income per share
66,269
63,815
65,012