Classmates.com 2006 Annual Report Download - page 33
Download and view the complete annual report
Please find page 33 of the 2006 Classmates.com annual report below. You can navigate through the pages in the report by either clicking on the pages listed below, or by using the keyword search tool below to find specific information within the annual report.-
 1
1 -
2
-
3
-
4
-
5
-
6
-
7
-
8
-
9
-
10
-
11
-
12
-
13
-
14
-
15
-
16
-
17
-
18
-
19
-
20
-
21
-
22
-
 23
23 -
 24
24 -
 25
25 -
 26
26 -
 27
27 -
 28
28 -
 29
29 -
 30
30 -
 31
31 -
 32
32 -
 33
33 -
 34
34 -
 35
35 -
 36
36 -
 37
37 -
 38
38 -
 39
39 -
 40
40 -
 41
41 -
 42
42 -
 43
43 -
44
-
45
-
46
-
47
-
48
-
49
-
50
-
51
-
52
-
53
-
54
-
55
-
56
-
57
-
58
-
59
-
60
-
61
-
62
-
63
-
64
-
65
-
66
-
67
-
68
-
69
-
70
-
71
-
72
-
73
-
74
-
75
-
76
-
77
-
78
-
79
-
80
-
81
-
82
-
83
-
84
-
85
-
86
-
87
-
88
-
89
-
90
-
91
-
92
-
93
-
94
-
95
-
96
-
97
-
98
-
99
-
100
-
101
-
102
-
103
-
104
-
105
-
106
-
107
-
108
-
109
-
110
-
111
-
112
-
113
-
114
-
115
-
116
-
117
-
118
-
119
-
120
-
121
-
122
-
123
-
124
-
125
-
126
-
127
-
128
-
129
-
130
-
131
-
132
-
133
-
134
-
135
-
136
-
137
-
138
-
139
-
140
-
141
-
142
-
143
-
144
-
145
-
146
-
147
-
148
-
149
-
150
-
151
-
152
-
153
-
154
-
155
-
156
-
157
-
158
-
159
-
160
-
161
-
162
-
163
-
164
-
165
-
166
-
167
-
168
-
169
-
170
-
171
-
172
-
173
-
174
-
175
 |
 |

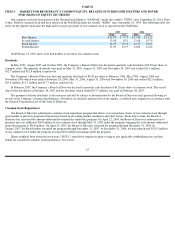
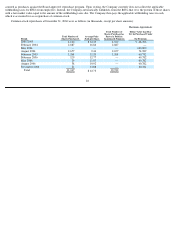
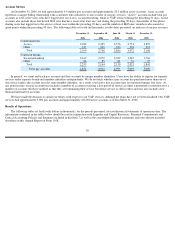
A reconciliation of segment income from operations (which excludes corporate expenses, depreciation, amortization of intangible assets
and stock-based compensation) to consolidated operating income, is as follows for each period presented (in thousands):
Communications segment income from operations for the year ended December 31, 2006 included restructuring charges of $0.6 million and
impairment charges of $4.5 million. Content & Media segment income from operations for the year ended December 31, 2006 included
impairment charges of $8.8 million. All of these charges are included in our operating expenses.
Year Ended December 31, 2006 compared to
Year Ended December 31, 2005
Comparability
On January 1, 2006, we adopted Statement of Financial Accounting Standards (“SFAS”) No. 123 (revised 2004), Share-Based Payment ,
which requires the measurement and recognition of compensation expense for all share-based payment awards made to employees and directors
including employee stock options, restricted stock awards and employee stock purchases related to the Employee Stock Purchase Plan
(“employee stock purchases”) based on the grant date fair values of the awards. SFAS No. 123R supersedes our previous accounting under
Accounting Principles Board (“APB”) Opinion No. 25, Accounting for Stock Issued to Employees . In March 2005, the SEC issued Staff
Accounting Bulletin (“SAB”)
No. 107 relating to SFAS No. 123R. We have applied the provisions of SAB No. 107 in our adoption of SFAS No.
123R.
We adopted SFAS No. 123R using the modified prospective transition method, and the Company’
s consolidated financial statements at and
for the year ended December 31, 2006 reflect the impact of SFAS No. 123R. In accordance with the modified prospective transition method, our
consolidated financial statements for prior periods have not been restated to reflect, and do not include, the impact of SFAS No. 123R. Stock-
based compensation expense recognized under SFAS No. 123R for the year ended December 31, 2006 was $19.2 million, which was primarily
related to stock options, restricted stock and the discount on employee stock purchases. Stock-based compensation expense, recorded in
accordance with APB Opinion No. 25, for the years ended December 31, 2005 and 2004 was $10.0 million and $2.4 million, respectively, which
was primarily related to restricted stock.
32
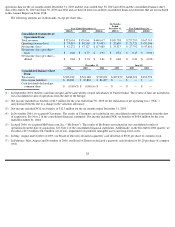
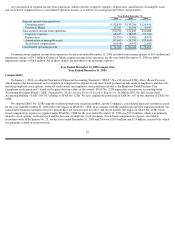
Year Ended December 31,
2006
2005
2004
Segment income from operations:
Communications
$
132,839
$
135,286
$
126,641
Content & Media
17,913
16,541
4,447
Total segment income from operations
150,752
151,827
131,088
Corporate expenses
(18,635
)
(18,035
)
(20,740
)
Depreciation
(21,290
)
(15,481
)
(8,003
)
Amortization of intangible assets
(17,640
)
(21,799
)
(20,403
)
Stock
-
based compensation
(19,168
)
(9,952
)
(2,449
)
Consolidated operating income
$
74,019
$
86,560
$
79,493