Classmates.com 2006 Annual Report Download - page 32
Download and view the complete annual report
Please find page 32 of the 2006 Classmates.com annual report below. You can navigate through the pages in the report by either clicking on the pages listed below, or by using the keyword search tool below to find specific information within the annual report.-
 1
1 -
2
-
3
-
4
-
5
-
6
-
7
-
8
-
9
-
10
-
11
-
12
-
13
-
14
-
15
-
16
-
17
-
18
-
19
-
20
-
21
-
 22
22 -
 23
23 -
 24
24 -
 25
25 -
 26
26 -
 27
27 -
 28
28 -
 29
29 -
 30
30 -
 31
31 -
 32
32 -
 33
33 -
 34
34 -
 35
35 -
 36
36 -
 37
37 -
 38
38 -
 39
39 -
 40
40 -
 41
41 -
 42
42 -
43
-
44
-
45
-
46
-
47
-
48
-
49
-
50
-
51
-
52
-
53
-
54
-
55
-
56
-
57
-
58
-
59
-
60
-
61
-
62
-
63
-
64
-
65
-
66
-
67
-
68
-
69
-
70
-
71
-
72
-
73
-
74
-
75
-
76
-
77
-
78
-
79
-
80
-
81
-
82
-
83
-
84
-
85
-
86
-
87
-
88
-
89
-
90
-
91
-
92
-
93
-
94
-
95
-
96
-
97
-
98
-
99
-
100
-
101
-
102
-
103
-
104
-
105
-
106
-
107
-
108
-
109
-
110
-
111
-
112
-
113
-
114
-
115
-
116
-
117
-
118
-
119
-
120
-
121
-
122
-
123
-
124
-
125
-
126
-
127
-
128
-
129
-
130
-
131
-
132
-
133
-
134
-
135
-
136
-
137
-
138
-
139
-
140
-
141
-
142
-
143
-
144
-
145
-
146
-
147
-
148
-
149
-
150
-
151
-
152
-
153
-
154
-
155
-
156
-
157
-
158
-
159
-
160
-
161
-
162
-
163
-
164
-
165
-
166
-
167
-
168
-
169
-
170
-
171
-
172
-
173
-
174
-
175
 |
 |

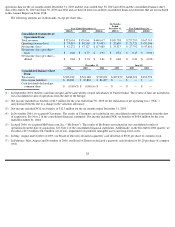
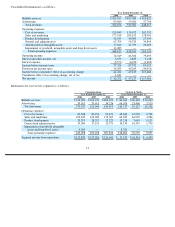
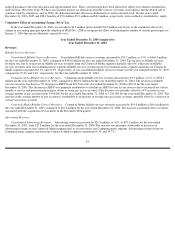
Consolidated information is as follows:
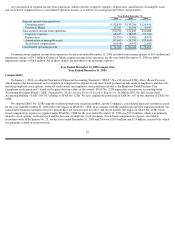
Information for our two key segments is as follows:
31
Year Ended December 31,
2006
2005
2004
Billable services
$
423,565
$
465,980
$
410,821
Advertising
99,089
59,081
37,796
Total revenues
522,654
525,061
448,617
Operating expenses:
Cost of revenues
120,049
110,672
102,392
Sales and marketing
177,019
209,292
178,981
Product development
52,933
40,009
27,454
General and administrative
67,709
56,729
39,894
Amortization of intangible assets
17,640
21,799
20,403
Impairment of goodwill, intangible assets and long-lived assets
13,285
—
—
Total operating expenses
448,635
438,501
369,124
Operating income
74,019
86,560
79,493
Interest and other income, net
6,076
6,885
5,138
Interest expense
(2,571
)
(6,073
)
(1,202
)
Income before income taxes
77,524
87,372
83,429
Provision for income taxes
36,293
40,245
(34,051
)
Income before cumulative effect of accounting change
41,231
47,127
117,480
Cumulative effect of accounting change, net of tax
1,041
—
—
Net income
$
42,272
$
47,127
$
117,480
Communications
Content & Media
Year Ended December 31,
Year Ended December 31,
2006
2005
2004
2006
2005
2004
Billable services
$
336,924
$
396,331
$
400,199
$
86,641
$
69,649
$
10,622
Advertising
39,013
35,613
34,276
60,076
23,468
3,520
Total revenues
375,937
431,944
434,475
146,717
93,117
14,142
Operating expenses:
Cost of revenues
81,048
89,254
94,451
28,640
12,503
2,794
Sales and marketing
109,245
162,032
174,585
64,035
46,093
3,986
Product development
29,295
28,217
25,223
13,218
7,643
1,125
General and administrative
19,006
17,155
13,575
14,130
10,337
1,790
Impairment of goodwill, intangible
assets and long
-
lived assets
4,504
—
—
8,781
—
—
Total operating expenses
243,098
296,658
307,834
128,804
76,576
9,695
Segment income from operations
$
132,839
$
135,286
$
126,641
$
17,913
$
16,541
$
4,447