Classmates.com 2006 Annual Report Download - page 101
Download and view the complete annual report
Please find page 101 of the 2006 Classmates.com annual report below. You can navigate through the pages in the report by either clicking on the pages listed below, or by using the keyword search tool below to find specific information within the annual report.-
 1
1 -
2
-
3
-
4
-
5
-
6
-
7
-
8
-
9
-
10
-
11
-
12
-
13
-
14
-
15
-
16
-
17
-
18
-
19
-
20
-
21
-
22
-
23
-
24
-
25
-
26
-
27
-
28
-
29
-
30
-
31
-
32
-
33
-
34
-
35
-
36
-
37
-
38
-
39
-
40
-
41
-
42
-
43
-
44
-
45
-
46
-
47
-
48
-
49
-
50
-
51
-
52
-
53
-
54
-
55
-
56
-
57
-
58
-
59
-
60
-
61
-
62
-
63
-
64
-
65
-
66
-
67
-
68
-
69
-
70
-
71
-
72
-
73
-
74
-
75
-
76
-
77
-
78
-
79
-
80
-
81
-
82
-
83
-
84
-
85
-
86
-
87
-
88
-
89
-
90
-
 91
91 -
 92
92 -
 93
93 -
 94
94 -
 95
95 -
 96
96 -
 97
97 -
 98
98 -
 99
99 -
 100
100 -
 101
101 -
 102
102 -
 103
103 -
 104
104 -
 105
105 -
 106
106 -
 107
107 -
 108
108 -
 109
109 -
 110
110 -
 111
111 -
112
-
113
-
114
-
115
-
116
-
117
-
118
-
119
-
120
-
121
-
122
-
123
-
124
-
125
-
126
-
127
-
128
-
129
-
130
-
131
-
132
-
133
-
134
-
135
-
136
-
137
-
138
-
139
-
140
-
141
-
142
-
143
-
144
-
145
-
146
-
147
-
148
-
149
-
150
-
151
-
152
-
153
-
154
-
155
-
156
-
157
-
158
-
159
-
160
-
161
-
162
-
163
-
164
-
165
-
166
-
167
-
168
-
169
-
170
-
171
-
172
-
173
-
174
-
175
 |
 |
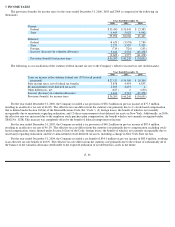
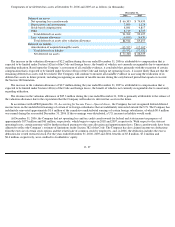
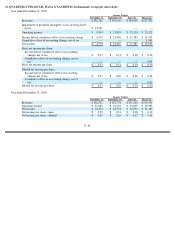
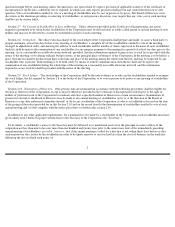
10. SEGMENT INFORMATION
Revenue and income from operations by segment are as follows (in thousands):
Communications segment income from operations for the year ended December 31, 2006 included restructuring charges of $0.6 million and
impairment charges of $4.5 million. Content & Media segment income from operations for the year ended December 31, 2006 included
impairment charges of $8.8 million. All of these charges are included in the Company’s operating expenses.
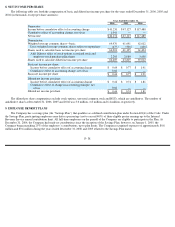
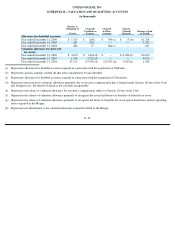
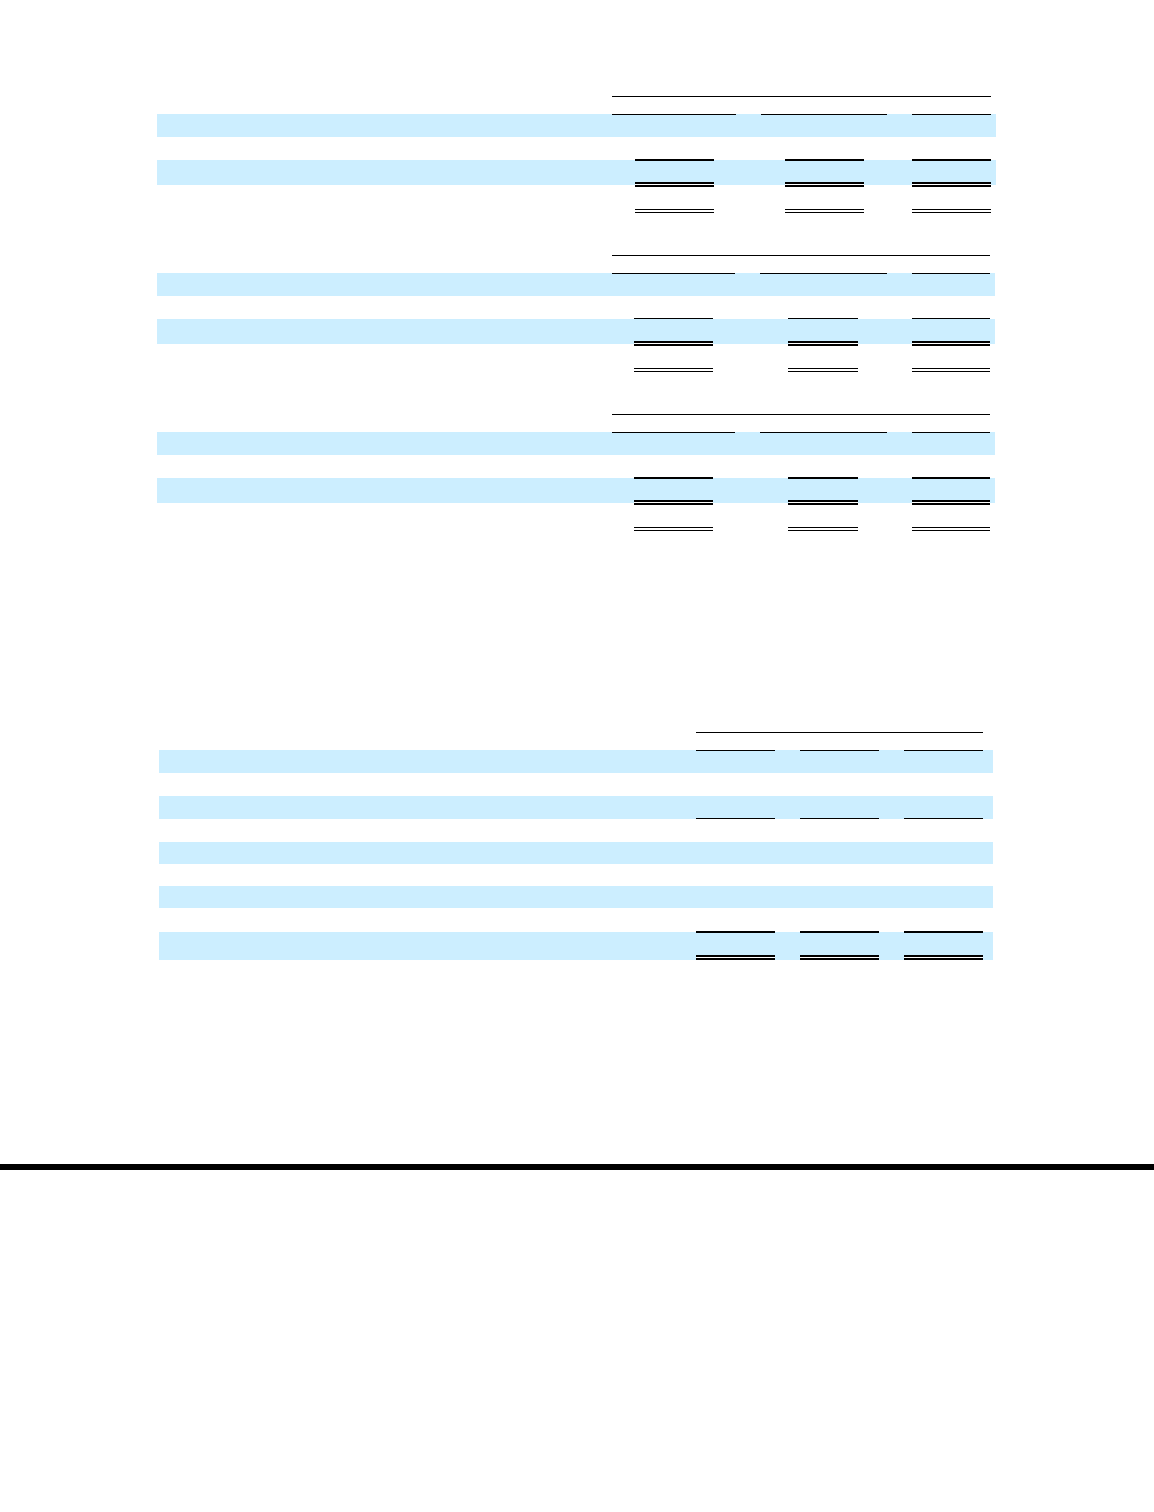
A reconciliation of segment income from operations (which excludes corporate expenses, depreciation, amortization of intangible assets
and stock-based compensation) to consolidated operating income, is as follows for each period presented (in thousands):
The Company manages its working capital on a consolidated basis and does not allocate long-
lived assets to segments. In addition, segment
assets are not reported to, or used by, the chief operating decision maker and therefore, pursuant to SFAS No. 131, total segment assets have not
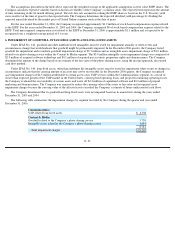
been disclosed. The Company’s $133.0 million of goodwill is related entirely to purchase transactions in the Content & Media segment.
F- 39
Year Ended December 31, 2006
Communications
Content & Media
Total
Billable services
$
336,924
$
86,641
$
423,565
Advertising
39,013
60,076
99,089
Total revenues
$
375,937
$
146,717
$
522,654
Segment income from operations
$
132,839
$
17,913
$
150,752
Year Ended December 31, 2005
Communications
Content & Media
Total
Billable services
$
396,331
$
69,649
$
465,980
Advertising
35,613
23,468
59,081
Total revenues
$
431,944
$
93,117
$
525,061
Segment income from operations
$
135,286
$
16,541
$
151,827
Year Ended December 31, 2004
Communications
Content & Media
Total
Billable services
$
400,199
$
10,622
$
410,821
Advertising
34,276
3,520
37,796
Total revenues
$
434,475
$
14,142
$
448,617
Segment income from operations
$
126,641
$
4,447
$
131,088
Year Ended December 31,
2006
2005
2004
Segment income from operations:
Communications
$
132,839
$
135,286
$
126,641
Content & Media
17,913
16,541
4,447
Total segment income from operations
150,752
151,827
131,088
Corporate expenses
(18,635
)
(18,035
)
(20,740
)
Depreciation
(21,290
)
(15,481
)
(8,003
)
Amortization of intangible assets
(17,640
)
(21,799
)
(20,403
)
Stock-based compensation
(19,168
)
(9,952
)
(2,449
)
Consolidated operating income
$
74,019
$
86,560
$
79,493