Classmates.com 2006 Annual Report Download - page 100
Download and view the complete annual report
Please find page 100 of the 2006 Classmates.com annual report below. You can navigate through the pages in the report by either clicking on the pages listed below, or by using the keyword search tool below to find specific information within the annual report.-
 1
1 -
2
-
3
-
4
-
5
-
6
-
7
-
8
-
9
-
10
-
11
-
12
-
13
-
14
-
15
-
16
-
17
-
18
-
19
-
20
-
21
-
22
-
23
-
24
-
25
-
26
-
27
-
28
-
29
-
30
-
31
-
32
-
33
-
34
-
35
-
36
-
37
-
38
-
39
-
40
-
41
-
42
-
43
-
44
-
45
-
46
-
47
-
48
-
49
-
50
-
51
-
52
-
53
-
54
-
55
-
56
-
57
-
58
-
59
-
60
-
61
-
62
-
63
-
64
-
65
-
66
-
67
-
68
-
69
-
70
-
71
-
72
-
73
-
74
-
75
-
76
-
77
-
78
-
79
-
80
-
81
-
82
-
83
-
84
-
85
-
86
-
87
-
88
-
89
-
 90
90 -
 91
91 -
 92
92 -
 93
93 -
 94
94 -
 95
95 -
 96
96 -
 97
97 -
 98
98 -
 99
99 -
 100
100 -
 101
101 -
 102
102 -
 103
103 -
 104
104 -
 105
105 -
 106
106 -
 107
107 -
 108
108 -
 109
109 -
 110
110 -
111
-
112
-
113
-
114
-
115
-
116
-
117
-
118
-
119
-
120
-
121
-
122
-
123
-
124
-
125
-
126
-
127
-
128
-
129
-
130
-
131
-
132
-
133
-
134
-
135
-
136
-
137
-
138
-
139
-
140
-
141
-
142
-
143
-
144
-
145
-
146
-
147
-
148
-
149
-
150
-
151
-
152
-
153
-
154
-
155
-
156
-
157
-
158
-
159
-
160
-
161
-
162
-
163
-
164
-
165
-
166
-
167
-
168
-
169
-
170
-
171
-
172
-
173
-
174
-
175
 |
 |

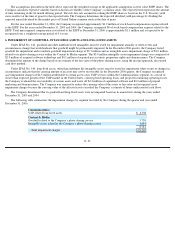
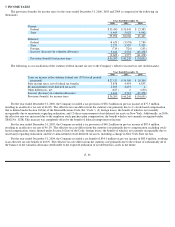
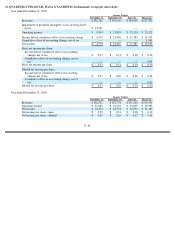
8. NET INCOME PER SHARE
The following table sets forth the computation of basic and diluted net income per share for the years ended December 31, 2006, 2005 and
2004 (in thousands, except per share amounts):
The diluted per share computations exclude stock options, unvested common stock and RSUs, which are antidilutive. The number of
antidilutive shares at December 31, 2006, 2005 and 2004 was 3.0 million, 6.8 million and 6.4 million, respectively.
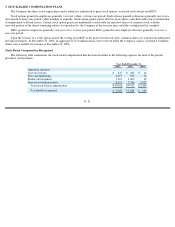
9. EMPLOYEE BENEFIT PLANS
The Company has a savings plan (the “Savings Plan”) that qualifies as a defined contribution plan under Section 401(k) of the Code. Under
the Savings Plan, participating employees may defer a percentage (not to exceed 40%) of their eligible pretax earnings up to the Internal
Revenue Service annual contribution limit. All full-time employees on the payroll of the Company are eligible to participate in the Plan. At
December 31, 2004, the Company had made no contributions since the inception of the Savings Plan; however, on January 1, 2005, the
Company began matching 25% of the employee’s contributions, up to plan limits. The Company recognized expenses of approximately $0.8
million and $0.6 million during the years ended December 31, 2006 and 2005 related to the Savings Plan match.
F- 38
Year Ended December 31,
2006
2005
2004
Numerator:
Income before cumulative effect of accounting change
$
41,231
$
47,127
$
117,480
Cumulative effect of accounting change, net of tax
1,041
—
—
Net income
$
42,272
$
47,127
$
117,480
Denominator:
Weighted
-
average common shares
—
basic
64,476
61,641
62,012
Less: weighted
-
average common shares subject to repurchase
(475
)
(506
)
(608
)
Shares used to calculate basic net income per share
64,001
61,135
61,404
Add: Dilutive effect of stock options, restricted stock and
employee stock purchase plan shares
2,268
2,680
3,608
Shares used to calculate diluted net income per share
66,269
63,815
65,012
Basic net income per share:
Income before cumulative effect of accounting change
$
0.64
$
0.77
$
1.91
Cumulative effect of accounting change, net of tax
0.02
—
—
Basic net income per share
$
0.66
$
0.77
$
1.91
Diluted net income per share:
Income before cumulative effect of accounting change
$
0.62
$
0.74
$
1.81
Cumulative effect of change in accounting principle, net
of tax
0.02
—
—
Diluted net income per share
$
0.64
$
0.74
$
1.81