Classmates.com 2006 Annual Report Download - page 29
Download and view the complete annual report
Please find page 29 of the 2006 Classmates.com annual report below. You can navigate through the pages in the report by either clicking on the pages listed below, or by using the keyword search tool below to find specific information within the annual report.-
 1
1 -
2
-
3
-
4
-
5
-
6
-
7
-
8
-
9
-
10
-
11
-
12
-
13
-
14
-
15
-
16
-
17
-
18
-
 19
19 -
 20
20 -
 21
21 -
 22
22 -
 23
23 -
 24
24 -
 25
25 -
 26
26 -
 27
27 -
 28
28 -
 29
29 -
 30
30 -
 31
31 -
 32
32 -
 33
33 -
 34
34 -
 35
35 -
 36
36 -
 37
37 -
 38
38 -
 39
39 -
40
-
41
-
42
-
43
-
44
-
45
-
46
-
47
-
48
-
49
-
50
-
51
-
52
-
53
-
54
-
55
-
56
-
57
-
58
-
59
-
60
-
61
-
62
-
63
-
64
-
65
-
66
-
67
-
68
-
69
-
70
-
71
-
72
-
73
-
74
-
75
-
76
-
77
-
78
-
79
-
80
-
81
-
82
-
83
-
84
-
85
-
86
-
87
-
88
-
89
-
90
-
91
-
92
-
93
-
94
-
95
-
96
-
97
-
98
-
99
-
100
-
101
-
102
-
103
-
104
-
105
-
106
-
107
-
108
-
109
-
110
-
111
-
112
-
113
-
114
-
115
-
116
-
117
-
118
-
119
-
120
-
121
-
122
-
123
-
124
-
125
-
126
-
127
-
128
-
129
-
130
-
131
-
132
-
133
-
134
-
135
-
136
-
137
-
138
-
139
-
140
-
141
-
142
-
143
-
144
-
145
-
146
-
147
-
148
-
149
-
150
-
151
-
152
-
153
-
154
-
155
-
156
-
157
-
158
-
159
-
160
-
161
-
162
-
163
-
164
-
165
-
166
-
167
-
168
-
169
-
170
-
171
-
172
-
173
-
174
-
175
 |
 |
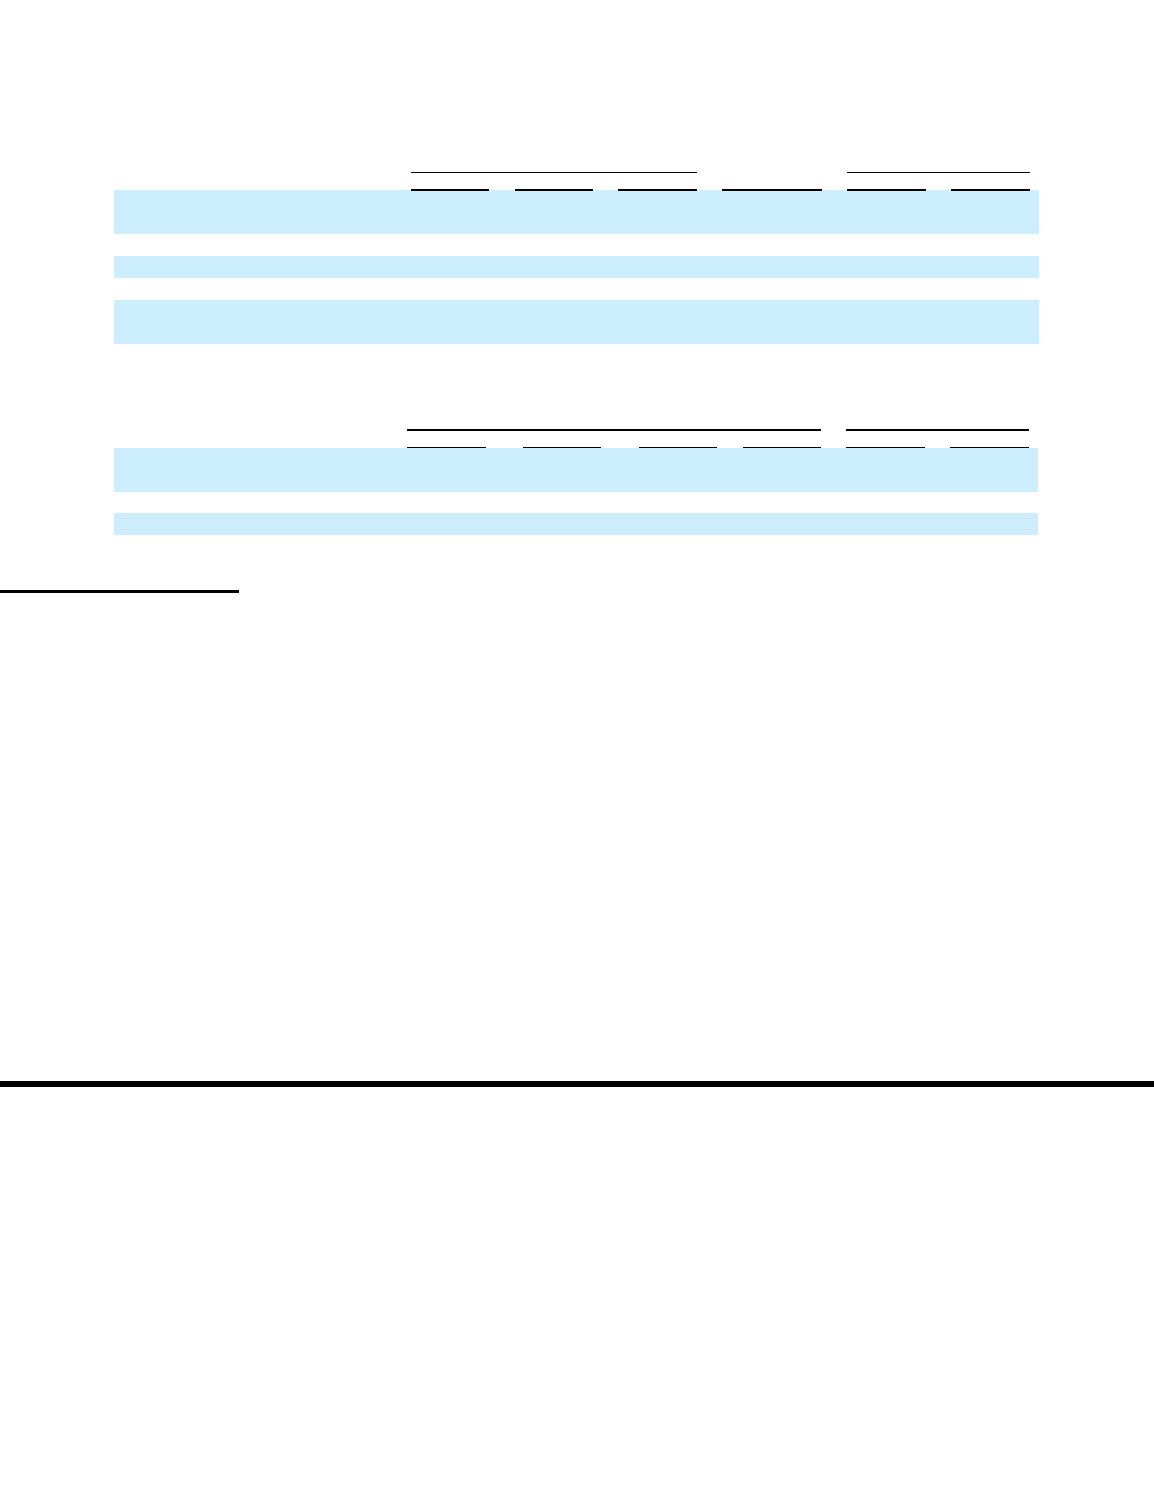
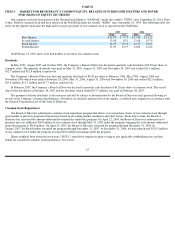
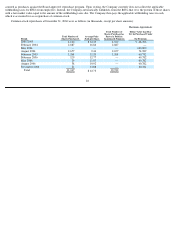
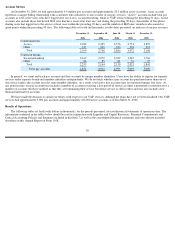
operations data for the six months ended December 31, 2003 and the years ended June 30, 2003 and 2002 and the consolidated balance sheet
data at December 31, 2003 and June 30, 2003 and 2002 and are derived from our audited consolidated financial statements that are not included
in this Annual Report on Form 10-K.
The following amounts are in thousands, except per share data:
(1)
In September 2001, NetZero and Juno merged and became wholly-
owned subsidiaries of United Online. The results of Juno are included in
our consolidated results of operations from the date of the Merger.
(2)
Net income included tax benefits of $4.3 million for the year ended June 30, 2003 for the realization of net operating loss (“NOL”)
carryforward benefits due to a change in the valuation allowance.
(3)
Net income included NOL tax benefits of $12.3 million for the six months ended December 31, 2003.
(4)
In November 2004, we acquired Classmates. The results of Classmates are included in our consolidated results of operations from the date
of acquisition. See Note 2 of the consolidated financial statements. Net income included NOL tax benefits of $68.6 million for the year
ended December 31, 2004.
(5)
In April 2006, we acquired MyPoints.com, Inc. (“MyPoints”). The results of MyPoints are included in our consolidated results of
operations from the date of acquisition. See Note 2 of the consolidated financial statements. Additionally, in the December 2006 quarter, we
recorded a $13.3 million ($8.0 million, net of tax), impairment of goodwill, intangible assets and long-lived assets.
(6)
In May, August and October of 2005, our Board of Directors declared a quarterly cash dividend of $0.20 per share of common stock.
(7)
In February, May, August and November of 2006, our Board of Directors declared a quarterly cash dividend of $0.20 per share of common
stock.
28
Year Ended December 31,
Six Months
Ended
December 31,
Year Ended June 30,
2006(5)
2005
2004(4)
2003(3)
2003(2)
2002(1)
Consolidated Statements of
Operations Data:
Total revenues
$
522,654
$
525,061
$
448,617
$
185,738
$
277,295
$
167,515
Operating income (loss)
$
74,019
$
86,560
$
79,493
$
32,639
$
21,721
$
(53,946
)
Net income (loss)
$
42,272
$
47,127
$
117,480
$
33,327
$
27,792
$
(47,810
)
Net income (loss) per share
—
basic
$
0.66
$
0.77
$
1.91
$
0.52
$
0.45
$
(0.90
)
Net income (loss) per share
—
diluted
$
0.64
$
0.74
$
1.81
$
0.48
$
0.41
$
(0.90
)
December 31,
June 30,
2006
2005
2004
2003
2003
2002
Consolidated Balance Sheet
Data:
Total assets
$
503,019
$
521,188
$
519,852
$
307,879
$
280,676
$
233,593
Non
-
current liabilities
$
10,983
$
45,863
$
81,207
$
—
$
—
$
—
Cash dividends declared per
common share
$
(0.80
)(7)
$
(0.60
)(6)
$
—
$
—
$
—
$
—