Classmates.com 2006 Annual Report Download - page 38
Download and view the complete annual report
Please find page 38 of the 2006 Classmates.com annual report below. You can navigate through the pages in the report by either clicking on the pages listed below, or by using the keyword search tool below to find specific information within the annual report.-
 1
1 -
2
-
3
-
4
-
5
-
6
-
7
-
8
-
9
-
10
-
11
-
12
-
13
-
14
-
15
-
16
-
17
-
18
-
19
-
20
-
21
-
22
-
23
-
24
-
25
-
26
-
27
-
 28
28 -
 29
29 -
 30
30 -
 31
31 -
 32
32 -
 33
33 -
 34
34 -
 35
35 -
 36
36 -
 37
37 -
 38
38 -
 39
39 -
 40
40 -
 41
41 -
 42
42 -
 43
43 -
 44
44 -
 45
45 -
 46
46 -
 47
47 -
 48
48 -
49
-
50
-
51
-
52
-
53
-
54
-
55
-
56
-
57
-
58
-
59
-
60
-
61
-
62
-
63
-
64
-
65
-
66
-
67
-
68
-
69
-
70
-
71
-
72
-
73
-
74
-
75
-
76
-
77
-
78
-
79
-
80
-
81
-
82
-
83
-
84
-
85
-
86
-
87
-
88
-
89
-
90
-
91
-
92
-
93
-
94
-
95
-
96
-
97
-
98
-
99
-
100
-
101
-
102
-
103
-
104
-
105
-
106
-
107
-
108
-
109
-
110
-
111
-
112
-
113
-
114
-
115
-
116
-
117
-
118
-
119
-
120
-
121
-
122
-
123
-
124
-
125
-
126
-
127
-
128
-
129
-
130
-
131
-
132
-
133
-
134
-
135
-
136
-
137
-
138
-
139
-
140
-
141
-
142
-
143
-
144
-
145
-
146
-
147
-
148
-
149
-
150
-
151
-
152
-
153
-
154
-
155
-
156
-
157
-
158
-
159
-
160
-
161
-
162
-
163
-
164
-
165
-
166
-
167
-
168
-
169
-
170
-
171
-
172
-
173
-
174
-
175
 |
 |

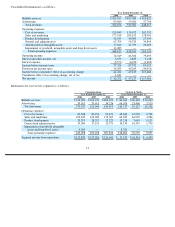
December 31, 2005 due to loyalty marketing cost of revenues comprising a larger percentage of revenues than our other Content & Media
properties. We anticipate that Content & Media cost of revenues as a percentage of Content & Media revenues will increase as a result of the
loyalty marketing acquisition and may vary significantly from quarter-to-quarter depending on increases or decreases in advertising revenue,
which can be impacted by seasonality and other factors.
Sales and Marketing
Sales and marketing expenses include advertising and promotion expenses, performance fees paid to distribution partners to acquire new
accounts, personnel-related expenses for sales and marketing personnel and telemarketing costs incurred to acquire and retain pay accounts and
up-sell pay accounts to additional services. Marketing and advertising costs to promote our products and services are expensed in the period
incurred. Advertising and promotion expenses include media, agency and promotion expenses. Media production costs are expensed the first
time the advertisement is run. Media and agency fees are expensed over the period the advertising runs. Sales expenses are expensed in the
period incurred or, in the case of commissions paid to sales personnel, when the associated advertising revenue is recognized.
Consolidated Sales and Marketing Expenses. Consolidated sales and marketing expenses decreased by $32.3 million, or 15%, to
$177.0 million, or 33.9% of consolidated revenues, for the year ended December 31, 2006, compared to $209.3 million, or 39.9% of
consolidated revenues, for the year ended December 31, 2005. The decrease was primarily attributable to a significant reduction in marketing
expenses related to our Communications segment, partially offset by an increase in marketing expenses related to our Content & Media segment
and a $2.5 million increase in stock-based compensation in connection with the adoption of SFAS No. 123R in the March 2006 quarter. Sales
and marketing expenses related to our Communications segment and our Content & Media segment constituted 63.0% and 37.0%, respectively,
of total segment sales and marketing expenses for the year ended December 31, 2006 versus 77.9% and 22.1%, respectively, for the year ended
December 31, 2005.
Communications Sales and Marketing Expenses. Communications sales and marketing expenses decreased by $52.8 million, or 33%, to
$109.2 million, or 29.1% of Communications revenues, for the year ended December 31, 2006, compared to $162.0 million, or 37.5% of
Communications revenues, for the year ended December 31, 2005. This decrease is attributable to a $61.4 million decline in advertising,
promotion and distribution costs related to our access services, the majority of which was due to reductions in media and other advertising costs.
These decreases were partially offset by a $5.1 million increase in VoIP marketing expenses and a $3.4 million increase in personnel and
overhead-related expenses.
Content & Media Sales and Marketing Expenses. Content & Media sales and marketing expenses increased by $17.9 million, or 39%, to
$64.0 million, or 43.6% of Content & Media revenues, for the year ended December 31, 2006, compared to $46.1 million, or 49.5% of
Content & Media revenues, for the year ended December 31, 2005. The increase was the result of the costs associated with our loyalty marketing
service which was acquired in April 2006, a $3.4 million increase in personnel and overhead-related expenses and a $2.0 million increase in
marketing, promotion and distribution costs related to acquiring and retaining accounts, particularly social-networking accounts. The vast
majority of non-personnel Content & Media marketing expenses are associated with performance-based advertising arrangements.
Product Development
Product development expenses include expenses for the maintenance of existing software and technology and the development of new or
improved software and technology, including personnel-related expenses for the software engineering department and the costs associated with
operating our facility in India. Costs incurred by us to manage, monitor and operate our services are generally expensed as
37