Classmates.com 2006 Annual Report Download - page 35
Download and view the complete annual report
Please find page 35 of the 2006 Classmates.com annual report below. You can navigate through the pages in the report by either clicking on the pages listed below, or by using the keyword search tool below to find specific information within the annual report.-
 1
1 -
2
-
3
-
4
-
5
-
6
-
7
-
8
-
9
-
10
-
11
-
12
-
13
-
14
-
15
-
16
-
17
-
18
-
19
-
20
-
21
-
22
-
23
-
24
-
 25
25 -
 26
26 -
 27
27 -
 28
28 -
 29
29 -
 30
30 -
 31
31 -
 32
32 -
 33
33 -
 34
34 -
 35
35 -
 36
36 -
 37
37 -
 38
38 -
 39
39 -
 40
40 -
 41
41 -
 42
42 -
 43
43 -
 44
44 -
 45
45 -
46
-
47
-
48
-
49
-
50
-
51
-
52
-
53
-
54
-
55
-
56
-
57
-
58
-
59
-
60
-
61
-
62
-
63
-
64
-
65
-
66
-
67
-
68
-
69
-
70
-
71
-
72
-
73
-
74
-
75
-
76
-
77
-
78
-
79
-
80
-
81
-
82
-
83
-
84
-
85
-
86
-
87
-
88
-
89
-
90
-
91
-
92
-
93
-
94
-
95
-
96
-
97
-
98
-
99
-
100
-
101
-
102
-
103
-
104
-
105
-
106
-
107
-
108
-
109
-
110
-
111
-
112
-
113
-
114
-
115
-
116
-
117
-
118
-
119
-
120
-
121
-
122
-
123
-
124
-
125
-
126
-
127
-
128
-
129
-
130
-
131
-
132
-
133
-
134
-
135
-
136
-
137
-
138
-
139
-
140
-
141
-
142
-
143
-
144
-
145
-
146
-
147
-
148
-
149
-
150
-
151
-
152
-
153
-
154
-
155
-
156
-
157
-
158
-
159
-
160
-
161
-
162
-
163
-
164
-
165
-
166
-
167
-
168
-
169
-
170
-
171
-
172
-
173
-
174
-
175
 |
 |

Beginning in May 2006, we shifted from a strategy of granting a combination of stock options and RSUs to solely granting RSUs.
Additionally, in March 2006, we offered eligible employees the opportunity to exchange any outstanding stock options granted to them, which
had an exercise price per share of our common stock at or above $16.00 (the “Eligible Options”) in return for RSUs. The exchange offer expired
in April 2006, and approximately 1.8 million shares of common stock underlying Eligible Options were exchanged for RSUs covering
approximately 0.4 million shares of common stock in exchange for the cancellation of the Eligible Options. Total expense associated with the
exchange, prior to the consideration of expected forfeitures, was approximately $0.8 million.
Total unrecognized compensation cost related to unvested stock option s at December 31, 2006, prior to the consideration of expected
forfeitures, is approximately $3.5 million and is expected to be recognized over a weighted-average period of 1.0 years. Total unrecognized
compensation cost related to unvested restricted stock and RSUs at December 31, 2006 prior to the consideration of expected forfeitures is
approximately $23.8 million and is expected to be recognized over a weighted-average period of 1.4 years.
Revenues
Billable Services Revenues
Billable services revenues consist of fees charged to pay accounts for our pay services and for technical support. Our billable services
revenues are primarily dependent on two factors: the average number of pay accounts for a period and the average monthly revenue per pay
account (“ARPU”) for a period. The average number of pay accounts is a simple average calculated based on the number of pay accounts at the
beginning and end of a period. ARPU is calculated by dividing billable services revenues for a period by the average number of pay accounts for
that period. ARPU may fluctuate from period to period as a result of a variety of factors including changes in the mix of pay subscriptions and
their related pricing plans; the use of promotions, such as one or more free months of service, and discounted pricing plans to obtain or retain
subscribers; increases or decreases in the price of our services; the number of services subscribed to by each pay account; pricing and success of
new pay services and the penetration of these types of services as a percentage of total pay accounts; and the timing of pay accounts being added
or removed during a period.
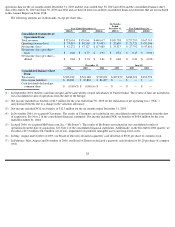
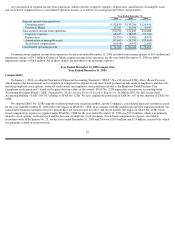
Consolidated Billable Services Revenues. Consolidated billable services revenues decreased by $42.4 million, or 9%, to $423.6 million
for the year ended December 31, 2006, compared to $466.0 million for the year ended December 31, 2005. The decrease in billable services
revenues was due to a decrease in billable services revenues from our Communications segment, partially offset by an increase in revenues from
our Content & Media segment. Billable services revenues from our Communications segment and from our Content & Media segment
constituted 79.5% and 20.5%, respectively, of our consolidated billable services revenues for the year ended December 31, 2006, compared to
85.1% and 14.9%, respectively, for the year ended December 31, 2005. We anticipate that our consolidated billable services revenues will
continue to decline as a result of expected continued declines in Communications billable services revenues.
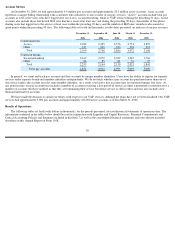
Communications Billable Services Revenues. Communications billable services revenues consist of fees charged to pay accounts for
access, email, Internet security and other services, with substantially all generated from access. Communications billable services revenues
decreased by $59.4 million, or 15%, to $336.9 million for the year ended December 31, 2006, compared to $396.3 million for the year ended
December 31, 2005. The decrease in billable services revenues was due to an 11% decrease in our average number of pay accounts from
3,236,000 for the year ended December 31, 2005 to 2,883,000 for the year ended December 31, 2006. The decrease in average number of pay
accounts is attributable to a decreased number of pay access accounts. Additionally, Communications billable services revenues decreased due to
a 5% decrease in ARPU from $10.21 for the year ended December 31, 2005 to $9.74 for the year ended December 31, 2006. The decrease in
ARPU is primarily attributable to a decline in ARPU for our access
34