Classmates.com 2006 Annual Report Download - page 46
Download and view the complete annual report
Please find page 46 of the 2006 Classmates.com annual report below. You can navigate through the pages in the report by either clicking on the pages listed below, or by using the keyword search tool below to find specific information within the annual report.-
 1
1 -
2
-
3
-
4
-
5
-
6
-
7
-
8
-
9
-
10
-
11
-
12
-
13
-
14
-
15
-
16
-
17
-
18
-
19
-
20
-
21
-
22
-
23
-
24
-
25
-
26
-
27
-
28
-
29
-
30
-
31
-
32
-
33
-
34
-
35
-
 36
36 -
 37
37 -
 38
38 -
 39
39 -
 40
40 -
 41
41 -
 42
42 -
 43
43 -
 44
44 -
 45
45 -
 46
46 -
 47
47 -
 48
48 -
 49
49 -
 50
50 -
 51
51 -
 52
52 -
 53
53 -
 54
54 -
 55
55 -
 56
56 -
57
-
58
-
59
-
60
-
61
-
62
-
63
-
64
-
65
-
66
-
67
-
68
-
69
-
70
-
71
-
72
-
73
-
74
-
75
-
76
-
77
-
78
-
79
-
80
-
81
-
82
-
83
-
84
-
85
-
86
-
87
-
88
-
89
-
90
-
91
-
92
-
93
-
94
-
95
-
96
-
97
-
98
-
99
-
100
-
101
-
102
-
103
-
104
-
105
-
106
-
107
-
108
-
109
-
110
-
111
-
112
-
113
-
114
-
115
-
116
-
117
-
118
-
119
-
120
-
121
-
122
-
123
-
124
-
125
-
126
-
127
-
128
-
129
-
130
-
131
-
132
-
133
-
134
-
135
-
136
-
137
-
138
-
139
-
140
-
141
-
142
-
143
-
144
-
145
-
146
-
147
-
148
-
149
-
150
-
151
-
152
-
153
-
154
-
155
-
156
-
157
-
158
-
159
-
160
-
161
-
162
-
163
-
164
-
165
-
166
-
167
-
168
-
169
-
170
-
171
-
172
-
173
-
174
-
175
 |
 |

Interest Expense
Interest expense increased by $4.9 million to $6.1 million for the year ended December 31, 2005, compared to $1.2 million for the year
ended December 31, 2004. The increase was primarily the result of interest on the outstanding balance on the term loan, which was issued in
December 2004. In January 2006, we repaid the remaining balance of $54.2 million on the term loan.
Provision for Income Taxes
For the year ended December 31, 2005, we recorded a tax provision of $40.2 million on pre-tax income of $87.4 million, resulting in an
effective tax rate of 46.1%. The effective tax rate differs from the statutory rate primarily due to compensation, including stock-based
compensation, that was limited under Section 162(m) of the Code; foreign losses, the benefit of which is not currently recognizable due to
uncertainty regarding realization; and the re-measurement of net deferred tax assets, including a change in New York state tax law. This re-
measurement resulted in an increase to the tax provision for the year ended December 31, 2005 by approximately $2.5 million, or 2.8%.
For the year ended December 31, 2004, we recorded a tax benefit of $34.1 million on pre-tax income of $83.4 million, resulting in an
effective tax rate benefit of 40.8%. The effective tax rate differs from the statutory rate primarily due to the release of substantially all of the
balance of the valuation allowance attributable to the expected utilization of net deferred tax assets in the future.
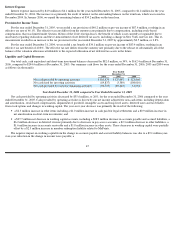
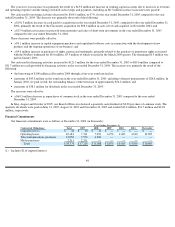
Liquidity and Capital Resources
Our total cash, cash equivalent and short-term investment balances decreased by $82.0 million, or 34%, to $162.4 million at December 31,
2006, compared to $244.4 million at December 31, 2005. Our summary cash flows for the years ended December 31, 2006, 2005 and 2004 were
as follows (in thousands):
Year Ended December 31, 2006 compared to Year Ended December 31, 2005
Net cash provided by operating activities decreased by $35.6 million, or 26%, for the year ended December 31, 2006 compared to the year
ended December 31, 2005. Cash provided by operating activities is driven by our net income adjusted for non-cash items, including depreciation
and amortization, stock-based compensation, impairment of goodwill, intangible assets and long-lived assets, deferred taxes and tax benefits
from stock options and changes in working capital. The year-over-year decrease was primarily the result of the following:
•
a $2.3 million increase in other items including a $1.0 million increase in cash paid for legal settlements and a $0.9 million increase in
net amortization on short-term investments; and
•
a $37.7 million net decrease in working capital accounts, including a $28.9 million decrease in accounts payable and accrued liabilities, a
$6.2 million decrease in deferred revenue primarily due to decreases in pay access accounts, a $2.3 million decrease in other liabilities, a
$1.6 million increase in accounts receivable and a $1.0 million increase in other assets. These decreases in working capital were partially
offset by a $2.3 million increase in member redemption liability related to MyPoints.
The negative impact on working capital from the change in accounts payable and accrued liability balances was due to a $9.1 million year-
over-year reduction in the change in income taxes payable; a
45
Year Ended
December 31,
2006
2005
2004
Net cash provided by operating activities
$
101,470
$
137,047
$
123,960
Net cash used for investing activities
(89,837
)
(3,389
)
(108,010
)
Net cash provided by (used for) financing activities
(92,725
)
(89,643
)
31,654