Classmates.com 2006 Annual Report Download - page 36
Download and view the complete annual report
Please find page 36 of the 2006 Classmates.com annual report below. You can navigate through the pages in the report by either clicking on the pages listed below, or by using the keyword search tool below to find specific information within the annual report.
services due to increased use of free months of service and promotional pricing to obtain or retain pay access accounts. We anticipate that the
average number of Communications pay accounts will continue to decline due to decreases in pay access accounts. We also may experience
further declines in ARPU primarily as a result of discounted prices for extended service commitments on our access services, including
providing our $14.95 accelerated access services at $9.95 for a one-year commitment. As a result of these factors, the rate of decline in
Communications billable services revenues has been increasing and may continue to increase, at least in the near term.
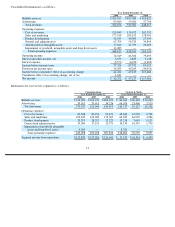
Content & Media Billable Services Revenues. Content & Media billable services revenues consist of fees charged to pay accounts for
social-networking, Web-hosting and other services, with substantially all generated from social-networking. Content & Media billable services
revenues increased by $17.0 million, or 24%, to $86.6 million for the year ended December 31, 2006, compared to $69.6 million for the year
ended December 31, 2005. The increase in Content & Media billable services revenues was due to a 22% increase in our average number of pay
accounts from 1,681,000 for the year ended December 31, 2005 to 2,048,000 for the year ended December 31, 2006. Substantially all of this
increase was associated with growth in our social-networking pay accounts primarily as a result of organic growth and, to a lesser extent, the
acquisition of pay accounts associated with The Names Database business in March 2006, which had approximately 58,000 pay accounts at the
time of the acquisition. Additionally, Content & Media billable services revenues increased due to a 2% increase in ARPU from $3.45 for the
year ended December 31, 2005 to $3.53 for the year ended December 31, 2006. The increase in ARPU is attributable to an increase in ARPU for
our social-networking services due to a greater percentage of those pay accounts represented by higher-priced, shorter-term pay service plans,
partially offset by decreases in ARPU for our Web-hosting and online photo-sharing services. We expect Content & Media billable services
revenues to grow sequentially at a faster rate in the March 2007 quarter versus the growth rate we experienced in the December 2006 quarter.
Advertising Revenues
We connect advertisers to consumers through a variety of online marketing initiatives integrated throughout our services and Web
properties, including advertising and search placements, email campaigns and user registration placements. In addition, we offer advertisers
sophisticated market research capabilities and online direct marketing solutions. Factors impacting our advertising revenues generally include
changes in orders from significant customers, the performance of our online marketing initiatives, the state of the online search and advertising
markets, seasonality, increases or decreases in our active accounts, and increases or decreases in advertising inventory available for sale.
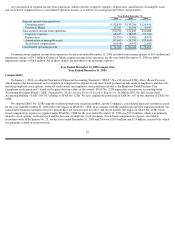
Consolidated Advertising Revenues. Consolidated advertising revenues increased by $40.0 million, or 68%, to $99.1 million for the year
ended December 31, 2006, compared to $59.1 million for the year ended December 31, 2005. The increase was primarily attributable to
increases in advertising revenues in our Content & Media segment and, to a lesser extent, our Communications segment. Advertising revenues
from our Communications segment and from our Content & Media segment constituted 39.4% and 60.6%, respectively, of our consolidated
advertising revenues for the year ended December 31, 2006, compared to 60.3% and 39.7%, respectively, for the year ended December 31, 2005.
We anticipate that our consolidated advertising revenues may decrease in the March 2007 quarter when compared to the December 2006 quarter
due to seasonality.
Communications Advertising Revenues. Communications advertising revenues increased by $3.4 million, or 10%, to $39.0 million for the
year ended December 31, 2006, from $35.6 million for the year ended December 31, 2005. The increase was primarily attributable to increases
in advertising sales and data revenue, partially offset by decreases in search revenues due to a decline in our active access accounts.
35


