Classmates.com 2006 Annual Report Download - page 42
Download and view the complete annual report
Please find page 42 of the 2006 Classmates.com annual report below. You can navigate through the pages in the report by either clicking on the pages listed below, or by using the keyword search tool below to find specific information within the annual report.-
 1
1 -
2
-
3
-
4
-
5
-
6
-
7
-
8
-
9
-
10
-
11
-
12
-
13
-
14
-
15
-
16
-
17
-
18
-
19
-
20
-
21
-
22
-
23
-
24
-
25
-
26
-
27
-
28
-
29
-
30
-
31
-
 32
32 -
 33
33 -
 34
34 -
 35
35 -
 36
36 -
 37
37 -
 38
38 -
 39
39 -
 40
40 -
 41
41 -
 42
42 -
 43
43 -
 44
44 -
 45
45 -
 46
46 -
 47
47 -
 48
48 -
 49
49 -
 50
50 -
 51
51 -
 52
52 -
53
-
54
-
55
-
56
-
57
-
58
-
59
-
60
-
61
-
62
-
63
-
64
-
65
-
66
-
67
-
68
-
69
-
70
-
71
-
72
-
73
-
74
-
75
-
76
-
77
-
78
-
79
-
80
-
81
-
82
-
83
-
84
-
85
-
86
-
87
-
88
-
89
-
90
-
91
-
92
-
93
-
94
-
95
-
96
-
97
-
98
-
99
-
100
-
101
-
102
-
103
-
104
-
105
-
106
-
107
-
108
-
109
-
110
-
111
-
112
-
113
-
114
-
115
-
116
-
117
-
118
-
119
-
120
-
121
-
122
-
123
-
124
-
125
-
126
-
127
-
128
-
129
-
130
-
131
-
132
-
133
-
134
-
135
-
136
-
137
-
138
-
139
-
140
-
141
-
142
-
143
-
144
-
145
-
146
-
147
-
148
-
149
-
150
-
151
-
152
-
153
-
154
-
155
-
156
-
157
-
158
-
159
-
160
-
161
-
162
-
163
-
164
-
165
-
166
-
167
-
168
-
169
-
170
-
171
-
172
-
173
-
174
-
175
 |
 |

reduced pursuant to the state allocation and apportionment laws. These carryforwards have been adjusted to reflect our estimate of limitations
under Section 382 of the Code. We have also claimed income tax deductions from the exercise of certain stock options and the related sale of
common stock by employees, and, in 2006, the deduction includes the excess deduction for vested restricted stock. For the years ended
December 31, 2006, 2005 and 2004, benefits of $5.8 million, $7.2 million and $8.6 million, respectively, were credited to stockholders’ equity.
Cumulative Effect of Accounting Change, Net of Tax
In the year ended December 31, 2006, we recorded a $1.1 million pretax benefit ($1.0 million, net of tax) as the cumulative effect of a
change in accounting principle upon the adoption of SFAS No. 123R to recognize the effect of estimating the number of awards granted prior to
January 1, 2006 that are not ultimately expected to vest.
Year Ended December 31, 2005 compared to
Year Ended December 31, 2004
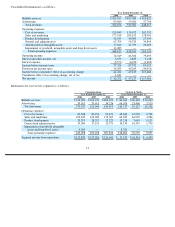
Revenues
Billable Services Revenues
Consolidated Billable Services Revenues. Consolidated billable services revenues increased by $55.2 million, or 13%, to $466.0 million
for the year ended December 31, 2005, compared to $410.8 million for the year ended December 31, 2004. The increase in billable services
revenues was due to an increase in billable services revenues from our Content & Media segment, partially offset by a decrease in billable
services revenues from our Communications segment. Billable services revenues from our Communications segment and from our Content &
Media segment constituted 85.1% and 14.9%, respectively, of our consolidated billable services revenues for the year ended December 31, 2005,
compared to 97.4% and 2.6%, respectively, for the year ended December 31, 2004.
Communications Billable Services Revenues. Communications billable services revenues decreased by $3.9 million, or 1%, to $396.3
million for the year ended December 31, 2005, compared to $400.2 million for the year ended December 31, 2004. The decrease in billable
services revenues was due to a 5% decrease in ARPU from $10.76 for the year ended December 31, 2004 to $10.21 for the year ended
December 31, 2005. The decrease in ARPU was primarily attributable to a decline in ARPU for our access services due to increased use of free
months of service and promotional pricing to obtain or retain pay access accounts. This decrease was partially offset by a 4% increase in our
average number of pay accounts from 3,098,000 for the year ended December 31, 2004 to 3,236,000 for the year ended December 31, 2005. The
increase in the average number of pay accounts is attributable to an increase in average non-access pay accounts, partially offset by a decrease in
average access pay accounts.
Content & Media Billable Services Revenues. Content & Media billable services revenues increased by $59.0 million to $69.6 million for
the year ended December 31, 2005, compared to $10.6 million for the year ended December 31, 2004. The increase is primarily due to revenues
associated with the acquisition of Classmates in the December 2004 quarter.
Advertising Revenues
Consolidated Advertising Revenues. Advertising revenues increased by $21.3 million, or 56%, to $59.1 million for the year ended
December 31, 2005, from $37.8 million for the year ended December 31, 2004. The increase was primarily attributable to increases in
advertising revenues in our Content & Media segment and, to a lesser extent, our Communications segment. Advertising revenues from our
Communications segment and from our Content & Media segment constituted 60.3% and 39.7%,
41