Classmates.com 2006 Annual Report Download - page 28
Download and view the complete annual report
Please find page 28 of the 2006 Classmates.com annual report below. You can navigate through the pages in the report by either clicking on the pages listed below, or by using the keyword search tool below to find specific information within the annual report.-
 1
1 -
2
-
3
-
4
-
5
-
6
-
7
-
8
-
9
-
10
-
11
-
12
-
13
-
14
-
15
-
16
-
17
-
 18
18 -
 19
19 -
 20
20 -
 21
21 -
 22
22 -
 23
23 -
 24
24 -
 25
25 -
 26
26 -
 27
27 -
 28
28 -
 29
29 -
 30
30 -
 31
31 -
 32
32 -
 33
33 -
 34
34 -
 35
35 -
 36
36 -
 37
37 -
 38
38 -
39
-
40
-
41
-
42
-
43
-
44
-
45
-
46
-
47
-
48
-
49
-
50
-
51
-
52
-
53
-
54
-
55
-
56
-
57
-
58
-
59
-
60
-
61
-
62
-
63
-
64
-
65
-
66
-
67
-
68
-
69
-
70
-
71
-
72
-
73
-
74
-
75
-
76
-
77
-
78
-
79
-
80
-
81
-
82
-
83
-
84
-
85
-
86
-
87
-
88
-
89
-
90
-
91
-
92
-
93
-
94
-
95
-
96
-
97
-
98
-
99
-
100
-
101
-
102
-
103
-
104
-
105
-
106
-
107
-
108
-
109
-
110
-
111
-
112
-
113
-
114
-
115
-
116
-
117
-
118
-
119
-
120
-
121
-
122
-
123
-
124
-
125
-
126
-
127
-
128
-
129
-
130
-
131
-
132
-
133
-
134
-
135
-
136
-
137
-
138
-
139
-
140
-
141
-
142
-
143
-
144
-
145
-
146
-
147
-
148
-
149
-
150
-
151
-
152
-
153
-
154
-
155
-
156
-
157
-
158
-
159
-
160
-
161
-
162
-
163
-
164
-
165
-
166
-
167
-
168
-
169
-
170
-
171
-
172
-
173
-
174
-
175
 |
 |
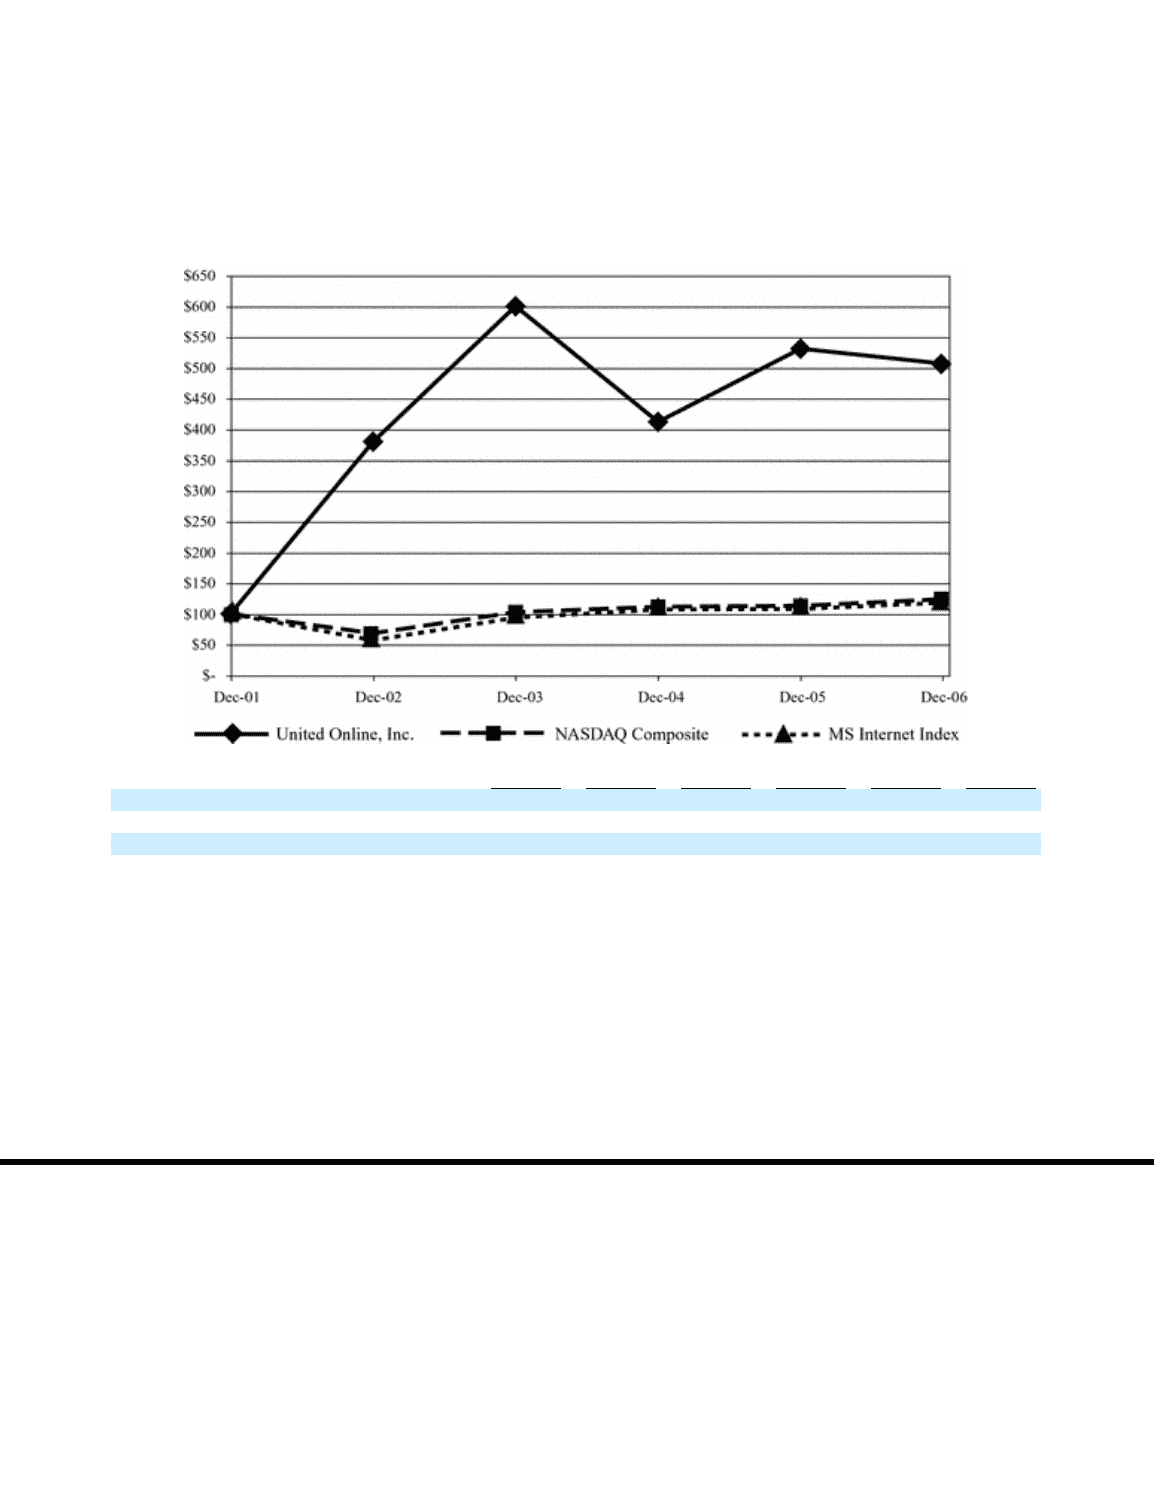
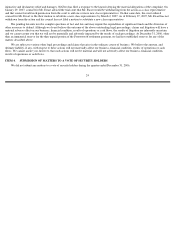
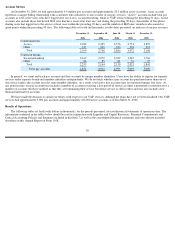
Performance Graph
This performance graph shall not be deemed “filed” for purposes of Section 18 of the Securities Exchange Act of 1934, as amended (the
“Exchange Act”) or otherwise subject to the liabilities under that Section and shall not be deemed to be incorporated by reference into any filing
of United Online under the Securities Act of 1933, as amended or the Exchange Act.
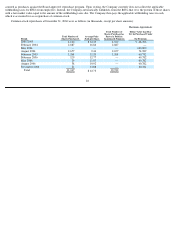
The following graph compares, for the five year period ended December 31, 2006, the cumulative total stockholder return for the
Company’s common stock, the Nasdaq Stock Market (U.S. companies) Index (the “NASDAQ Composite”) and the Morgan Stanley Internet
Index (“MS Internet Index”). Measurement points are the last trading day of each of the Company’s fiscal years ended December 31, 2001,
2002, 2003, 2004, 2005 and 2006. The graph assumes that $100 was invested on December 31, 2001 in the common stock of the Company, the
NASDAQ Composite and the MS Internet Index and assumes reinvestment of any dividends. The stock price performance on the following
graph is not necessarily indicative of future stock price performance.
ITEM 6.
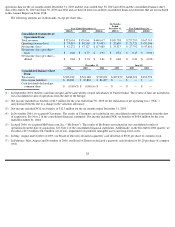
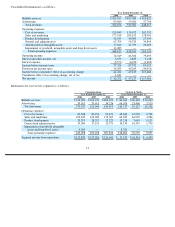
SELECTED FINANCIAL DATA
The following selected consolidated financial data should be read in conjunction with our consolidated financial statements and related
notes and Management’
s Discussion and Analysis of Financial Condition and Results of Operations included elsewhere in this Annual Report on
Form 10-K.
The following table presents the consolidated statements of operations data for the years ended December 31, 2006, 2005 and 2004, and the
consolidated balance sheet data at December 31, 2006 and 2005. Such financial data are derived from our audited consolidated financial
statements included elsewhere in this Annual Report on Form 10-K. The table also presents the consolidated statements of
27
Dec
-
01
Dec
-
02
Dec
-
03
Dec
-
04
Dec
-
05
Dec
-
06
United Online, Inc.
$
100.00
$
379.54
$
599.64
$
411.79
$
530.70
$
506.33
NASDAQ Composite
$
100.00
$
68.47
$
102.72
$
111.54
$
113.07
$
123.84
MS Internet Index
$
100.00
$
57.14
$
93.80
$
107.07
$
107.94
$
118.11