Cisco 2004 Annual Report Download - page 59
Download and view the complete annual report
Please find page 59 of the 2004 Cisco annual report below. You can navigate through the pages in the report by either clicking on the pages listed below, or by using the keyword search tool below to find specific information within the annual report.-
 1
1 -
2
-
3
-
4
-
5
-
6
-
7
-
8
-
9
-
10
-
11
-
12
-
13
-
14
-
15
-
16
-
17
-
18
-
19
-
20
-
21
-
22
-
23
-
24
-
25
-
26
-
27
-
28
-
29
-
30
-
31
-
32
-
33
-
34
-
35
-
36
-
37
-
38
-
39
-
40
-
41
-
42
-
43
-
44
-
45
-
46
-
47
-
48
-
 49
49 -
 50
50 -
 51
51 -
 52
52 -
 53
53 -
 54
54 -
 55
55 -
 56
56 -
 57
57 -
 58
58 -
 59
59 -
 60
60 -
 61
61 -
 62
62 -
 63
63 -
 64
64 -
 65
65 -
 66
66 -
 67
67
 |
 |

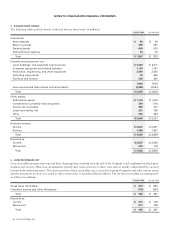
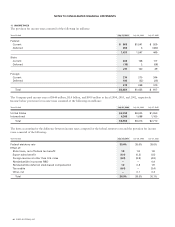
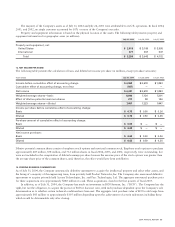
11. INCOME TAXES
The provision for income taxes consisted of the following (in millions):
Years Ended July 31, 2004 July 26, 2003 July 27, 2002
Federal:
Current $ 968 $1,041 $ 929
Deferred 469 6 (480)
1,437 1,047 449
State:
Current 230 138 117
Deferred (19) 2 (68)
211 140 49
Foreign:
Current 274 270 344
Deferred 102 (22) (25)
376 248 319
Total $2,024 $1,435 $817
The Company paid income taxes of $644 million, $1.4 billion, and $909 million in fiscal 2004, 2003, and 2002, respectively.
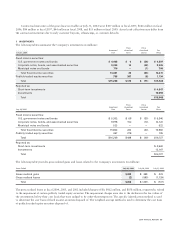
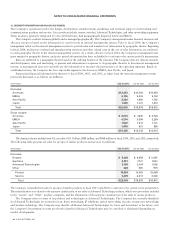
Income before provision for income taxes consisted of the following (in millions):
Years Ended July 31, 2004 July 26, 2003 July 27, 2002
United States $2,743 $3,325 $1,550
International 4,249 1,688 1,160
Total $6,992 $ 5,013 $ 2,710
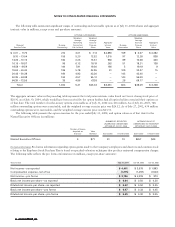
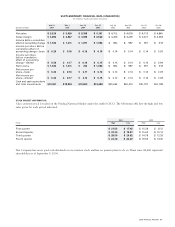
The items accounting for the difference between income taxes computed at the federal statutory rate and the provision for income
taxes consisted of the following:
Years Ended July 31, 2004 July 26, 2003 July 27, 2002
Federal statutory rate 35.0% 35.0% 35.0%
Effect of:
State taxes, net of federal tax benefit 1.8 1.8 1. 8
Export sales benefit (0.4) (0.2) (1.5)
Foreign income at other than U.S. rates (8.3) (8.9) (4.9)
Nondeductible in-process R&D —— 0.9
Nondeductible deferred stock-based compensation 1.2 0.8 1.9
Tax credits (0.4) — (3.4)
Other, net —0.1 0.3
Total 28.9% 28.6% 30.1%
62 CISCO SYSTEMS, INC.
NOTES TO CONSOLIDATED FINANCIAL STATEMENTS