Cisco 2004 Annual Report Download - page 51
Download and view the complete annual report
Please find page 51 of the 2004 Cisco annual report below. You can navigate through the pages in the report by either clicking on the pages listed below, or by using the keyword search tool below to find specific information within the annual report.-
 1
1 -
2
-
3
-
4
-
5
-
6
-
7
-
8
-
9
-
10
-
11
-
12
-
13
-
14
-
15
-
16
-
17
-
18
-
19
-
20
-
21
-
22
-
23
-
24
-
25
-
26
-
27
-
28
-
29
-
30
-
31
-
32
-
33
-
34
-
35
-
36
-
37
-
38
-
39
-
40
-
 41
41 -
 42
42 -
 43
43 -
 44
44 -
 45
45 -
 46
46 -
 47
47 -
 48
48 -
 49
49 -
 50
50 -
 51
51 -
 52
52 -
 53
53 -
 54
54 -
 55
55 -
 56
56 -
 57
57 -
 58
58 -
 59
59 -
 60
60 -
 61
61 -
62
-
63
-
64
-
65
-
66
-
67
 |
 |

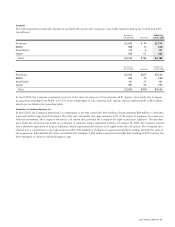
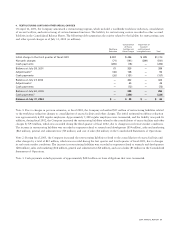
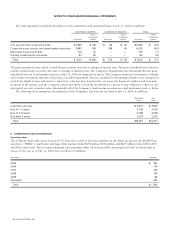
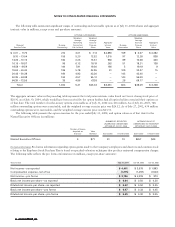
The following table provides the breakdown of the investments with unrealized losses at July 31, 2004 (in millions):
LESS THAN 12 MONTHS 12 MONTHS OR GREATER TOTAL
Gross Gross Gross
Unrealized Unrealized Unrealized
Fair Value Losses Fair Value Losses Fair Value Losses
U.S. government notes and bonds $2,859 $ (18) $ 84 $ (2) $2,943 $ (20)
Corporate notes, bonds, and asset-backed securities 3,883 (38) 189 (4) 4,072 (42)
Municipal notes and bonds 176 (1) — — 176 (1)
Publicly traded equity securities 83 (8) — — 83 (8)
Total $ 7,001 $ (65) $ 273 $ (6) $ 7,274 $ (71)
The gross unrealized losses related to fixed income securities were due to changes in interest rates. The gross unrealized losses related to
publicly traded equity securities were due to changes in market prices. The Company’s management has determined that the gross
unrealized losses on its investment securities at July 31, 2004 are temporary in nature. The Company reviews its investments to identify
and evaluate investments that have indications of possible impairment. Factors considered in determining whether a loss is temporary
include the length of time and extent to which fair value has been less than the cost basis, the financial condition and near-term
prospects of the investee, and the Company’s intent and ability to hold the investment for a period of time sufficient to allow for any
anticipated recovery in market value. Substantially all of the Company’s fixed income securities are rated investment grade or better.
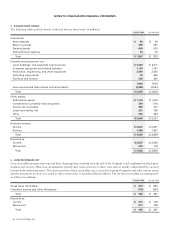
The following table summarizes the maturities of the Company’s fixed income securities at July 31, 2004 (in millions):
Amortized Fair
Cost Value
Less than one year $ 4,951 $ 4,947
Due in 1–2 years3,138 3,130
Due in 2–5 years4,088 4,064
Due after 5 years 2,274 2,270
Total $14,451 $14,411
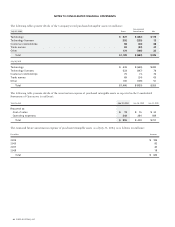
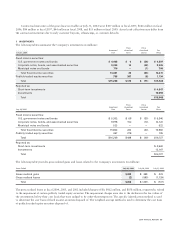
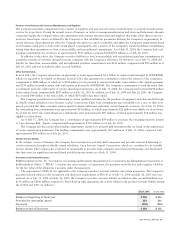
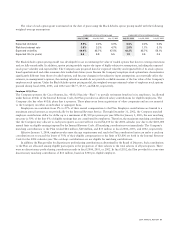
8. COMMITMENTS AND CONTINGENCIES
Operating Leases
The Company leases office space in several U.S. locations, as well as locations elsewhere in the Americas; Europe, the Middle East,
and Africa (“EMEA”); Asia Pacific; and Japan. Rent expense totaled $191 million, $196 million, and $265 million in fiscal 2004, 2003,
and 2002, respectively. Future annual minimum lease payments under all noncancelable operating leases with an initial term in
excess of one year as of July 31, 2004 were as follows (in millions):
Fiscal Year Amount
2005 $ 231
2006 176
2007 130
2008 104
2009 83
Thereafter 632
Total $ 1,356
54 CISCO SYSTEMS, INC.
NOTES TO CONSOLIDATED FINANCIAL STATEMENTS