Cisco 2004 Annual Report Download - page 18
Download and view the complete annual report
Please find page 18 of the 2004 Cisco annual report below. You can navigate through the pages in the report by either clicking on the pages listed below, or by using the keyword search tool below to find specific information within the annual report.-
 1
1 -
2
-
3
-
4
-
5
-
6
-
7
-
 8
8 -
 9
9 -
 10
10 -
 11
11 -
 12
12 -
 13
13 -
 14
14 -
 15
15 -
 16
16 -
 17
17 -
 18
18 -
 19
19 -
 20
20 -
 21
21 -
 22
22 -
 23
23 -
 24
24 -
 25
25 -
 26
26 -
 27
27 -
 28
28 -
29
-
30
-
31
-
32
-
33
-
34
-
35
-
36
-
37
-
38
-
39
-
40
-
41
-
42
-
43
-
44
-
45
-
46
-
47
-
48
-
49
-
50
-
51
-
52
-
53
-
54
-
55
-
56
-
57
-
58
-
59
-
60
-
61
-
62
-
63
-
64
-
65
-
66
-
67
 |
 |

Income Taxes
We are subject to income taxes in both the U.S. and numerous foreign jurisdictions. Significant judgment is required in evaluating
our tax positions and determining our provision for income taxes. During the ordinary course of business, there are many transactions
and calculations for which the ultimate tax determination is uncertain. We establish reserves for tax-related uncertainties based on
estimates of whether, and the extent to which, additional taxes and interest will be due. These reserves are established when, despite
our belief that our tax return positions are fully supportable, we believe that certain positions are likely to be challenged and may not
be sustained on review by tax authorities. We adjust these reserves in light of changing facts and circumstances, such as the closing
of a tax audit. The provision for income taxes includes the impact of reserve provisions and changes to reserves that are considered
appropriate, as well as the related net interest.
Our effective tax rates differ from the statutory rate primarily due to acquisition-related costs, research and experimentation tax
credits, state taxes, and the tax impact of foreign operations. The effective tax rate was 28.9%, 28.6%, and 30.1% for fiscal 2004, 2003,
and 2002, respectively. Our future effective tax rates could be adversely affected by earnings being lower than anticipated in countries
where we have lower statutory rates and higher than anticipated in countries where we have higher statutory rates, by changes in the
valuation of our deferred tax assets or liabilities, or by changes in tax laws or interpretations thereof. In addition, we are subject to
the continuous examination of our income tax returns by the Internal Revenue Service and other tax authorities. We regularly assess
the likelihood of adverse outcomes resulting from these examinations to determine the adequacy of our provision for income taxes.
Loss Contingencies
We are subject to the possibility of various loss contingencies arising in the ordinary course of business. We consider the likelihood
of loss or impairment of an asset or the incurrence of a liability, as well as our ability to reasonably estimate the amount of loss in
determining loss contingencies. An estimated loss contingency is accrued when it is probable that an asset has been impaired or a liability
has been incurred and the amount of loss can be reasonably estimated. We regularly evaluate current information available to us to
determine whether such accruals should be adjusted and whether new accruals are required.
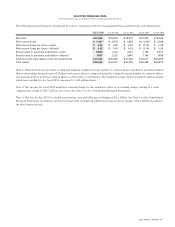
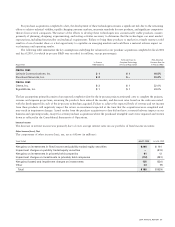
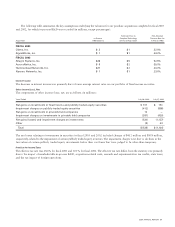
FINANCIAL DATA FOR FISCAL 2004, 2003, AND 2002
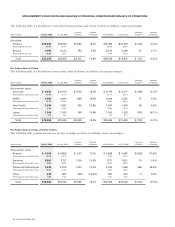
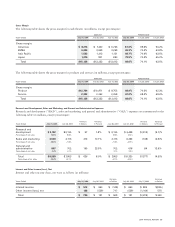
Net Sales
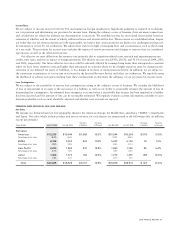
We manage our business based on four geographic theaters: the Americas; Europe, the Middle East, and Africa (“EMEA”); Asia Pacific;
and Japan. Net sales, which include product and service revenue, for each theater are summarized in the following table (in millions,
except percentages):
Variance Variance Variance Variance
Years Ended July 31, 2004 July 26, 2003 in Dollars in Percent July 26, 2003 July 27, 2002 in Dollars in Percent
Net sales:
Americas $ 12,233 $ 10,544 $ 1,689 16.0% $ 10,544 $10,654 $(110) (1.0)%
Percentage of net sales 55.5% 55.8% 55.8% 56.4%
EMEA 6,126 5,202 924 17.8% 5,202 5,126 76 1.5%
Percentage of net sales 27.8% 27.6% 27.6% 27.1%
Asia Pacific 2,230 1,860 370 19.9% 1,860 1,765 95 5.4%
Percentage of net sales 10.1% 9.9% 9.9% 9.3%
Japan 1,456 1,272 184 14.5% 1,272 1,370 (98) (7.2)%
Percentage of net sales 6.6% 6.7% 6.7% 7.2%
Total $ 22,045 $18,878 $ 3,167 16.8% $18,878 $18,915 $ (37) (0.2)%
2004 ANNUAL REPORT 21