Cisco 2004 Annual Report Download - page 14
Download and view the complete annual report
Please find page 14 of the 2004 Cisco annual report below. You can navigate through the pages in the report by either clicking on the pages listed below, or by using the keyword search tool below to find specific information within the annual report.-
 1
1 -
2
-
3
-
 4
4 -
 5
5 -
 6
6 -
 7
7 -
 8
8 -
 9
9 -
 10
10 -
 11
11 -
 12
12 -
 13
13 -
 14
14 -
 15
15 -
 16
16 -
 17
17 -
 18
18 -
 19
19 -
 20
20 -
 21
21 -
 22
22 -
 23
23 -
 24
24 -
25
-
26
-
27
-
28
-
29
-
30
-
31
-
32
-
33
-
34
-
35
-
36
-
37
-
38
-
39
-
40
-
41
-
42
-
43
-
44
-
45
-
46
-
47
-
48
-
49
-
50
-
51
-
52
-
53
-
54
-
55
-
56
-
57
-
58
-
59
-
60
-
61
-
62
-
63
-
64
-
65
-
66
-
67
 |
 |

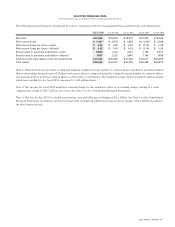
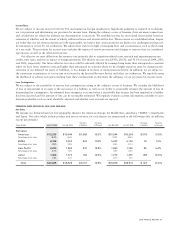
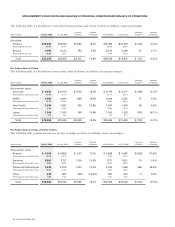
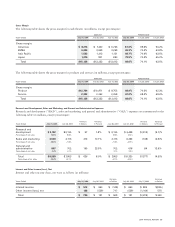
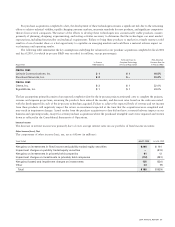
The following selected financial data should be read in conjunction with the Consolidated Financial Statements and related notes:
July 31, 2004 July 26, 2003 July 27, 2002 July 28, 2001 July 29, 2000
Net sales $22,045 $ 18,878 $ 18,915 $ 22,293 $18,928
Net income (loss) $ 4,401(2) $ 3,578 $ 1,893 $ (1,014)(3) $ 2,668
Net income (loss) per share—basic $ 0.64 $ 0.50 $ 0.26 $ (0.14) $ 0.39
Net income (loss) per share—diluted(1) $ 0.62 $ 0.50 $ 0.25 $ (0.14) $ 0.36
Shares used in per-share calculation—basic 6,840 7,124 7,301 7,196 6,917
Shares used in per-share calculation—diluted(1) 7,057 7,223 7,447 7,196 7,438
Cash and cash equivalents and total investments $ 19,267 $ 20,652 $21,456 $ 18,517 $20,499
Total assets $35,594 $ 37,107 $ 37,795 $ 35,238 $32,870
Note 1: Diluted net income per share is computed using the weighted-average number of common shares and dilutive potential common
shares outstanding during the period. Diluted net loss per share is computed using the weighted-average number of common shares
and excludes dilutive potential common shares, as their effect is antidilutive. The weighted-average dilutive potential common shares,
which were antidilutive for fiscal 2001, amounted to 348 million shares.
Note 2: Net income for fiscal 2004 included a noncash charge for the cumulative effect of accounting change relating to a stock
compensation charge of $567 million, net of tax. See Note 3 to the Consolidated Financial Statements.
Note 3: Net loss for fiscal 2001 included restructuring costs and other special charges of $1.2 billion. See Note 4 to the Consolidated
Financial Statements. In addition, net loss for fiscal 2001 included an additional excess inventory charge of $2.2 billion recorded in
the third quarter period.
2004 ANNUAL REPORT 17
SELECTED FINANCIAL DATA
Five Years Ended July 31, 2004 (in millions, except per-share amounts)