Cisco 2004 Annual Report Download - page 50
Download and view the complete annual report
Please find page 50 of the 2004 Cisco annual report below. You can navigate through the pages in the report by either clicking on the pages listed below, or by using the keyword search tool below to find specific information within the annual report.-
 1
1 -
2
-
3
-
4
-
5
-
6
-
7
-
8
-
9
-
10
-
11
-
12
-
13
-
14
-
15
-
16
-
17
-
18
-
19
-
20
-
21
-
22
-
23
-
24
-
25
-
26
-
27
-
28
-
29
-
30
-
31
-
32
-
33
-
34
-
35
-
36
-
37
-
38
-
39
-
 40
40 -
 41
41 -
 42
42 -
 43
43 -
 44
44 -
 45
45 -
 46
46 -
 47
47 -
 48
48 -
 49
49 -
 50
50 -
 51
51 -
 52
52 -
 53
53 -
 54
54 -
 55
55 -
 56
56 -
 57
57 -
 58
58 -
 59
59 -
 60
60 -
61
-
62
-
63
-
64
-
65
-
66
-
67
 |
 |
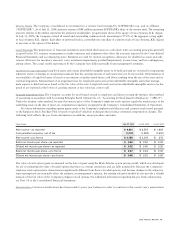
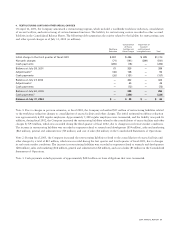
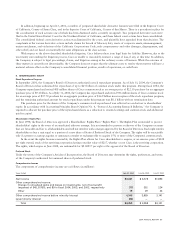
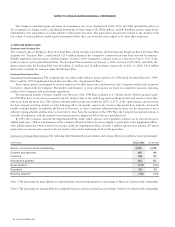
Contractual maturities of the gross lease receivables at July 31, 2004 were $307 million in fiscal 2005, $166 million in fiscal
2006, $84 million in fiscal 2007, $44 million in fiscal 2008, and $15 million in fiscal 2009. Actual cash collections may differ from
the contractual maturities due to early customer buyouts, refinancings, or customer defaults.
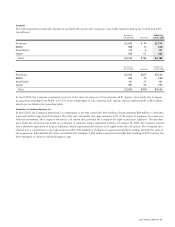
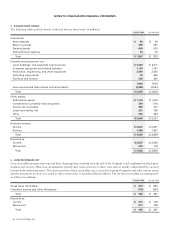
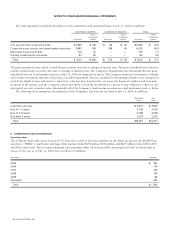
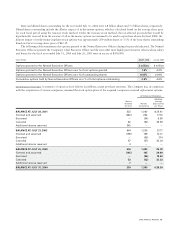
7. INVESTMENTS
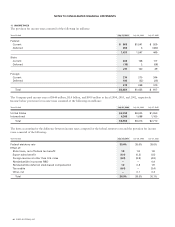
The following tables summarize the Company’s investments (in millions):
Gross Gross
Amortized Unrealized Unrealized Fair
July 31, 2004 Cost Gains Losses Value
Fixed income securities:
U.S. government notes and bonds $ 4,408 $ 9 $ (20) $ 4,397
Corporate notes, bonds, and asset-backed securities 9,333 14 (42) 9,305
Municipal notes and bonds 710 — (1) 709
Total fixed income securities 14,451 23 (63) 14,411
Publicly traded equity securities 755 387 (8) 1,134
Total $15,206 $ 410 $ (71) $15,545
Reported as:
Short-term investments $4,947
Investments 10,598
Total $15,545
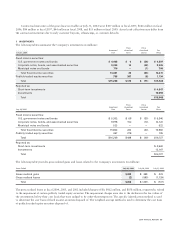
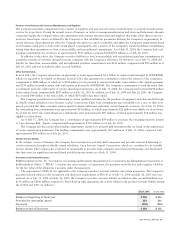
Gross Gross
Amortized Unrealized Unrealized Fair
July 26, 2003 Cost Gains Losses Value
Fixed income securities:
U.S. government notes and bonds $ 5,302 $ 68 $ (30) $ 5,340
Corporate notes, bonds, and asset-backed securities 9,978 152 (10) 10,120
Municipal notes and bonds 522 — — 522
Total fixed income securities 15,802 220 (40) 15,982
Publicly traded equity securities 467 278 — 745
Total $16,269 $498 $ (40) $16,727
Reported as:
Short-term investments $ 4,560
Investments 12,167
Total $16,727
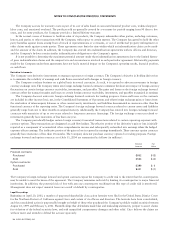
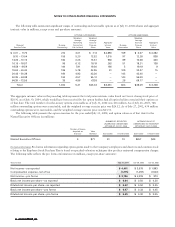
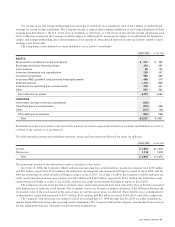
The following table provides gross realized gains and losses related to the Company’s investments (in millions):
Years Ended July 31, 2004 July 26, 2003 July 27, 2002
Gross realized gains $208 $ 339 $ 422
Gross realized losses (2) (590) (1,129)
Total $206 $(251) $ (707)
The gross realized losses in fiscal 2004, 2003, and 2002 included charges of $0, $412 million, and $858 million, respectively, related
to the impairment of certain publicly traded equity securities. The impairment charges were due to the declines in the fair values of
the investments below their cost basis that were judged to be other-than-temporary. The specific identification method is used
to determine the cost basis of fixed income securities disposed of. The weighted-average method is used to determine the cost basis
of publicly traded equity securities disposed of.
2004 ANNUAL REPORT 53