Cisco 2004 Annual Report Download - page 20
Download and view the complete annual report
Please find page 20 of the 2004 Cisco annual report below. You can navigate through the pages in the report by either clicking on the pages listed below, or by using the keyword search tool below to find specific information within the annual report.-
 1
1 -
2
-
3
-
4
-
5
-
6
-
7
-
8
-
9
-
 10
10 -
 11
11 -
 12
12 -
 13
13 -
 14
14 -
 15
15 -
 16
16 -
 17
17 -
 18
18 -
 19
19 -
 20
20 -
 21
21 -
 22
22 -
 23
23 -
 24
24 -
 25
25 -
 26
26 -
 27
27 -
 28
28 -
 29
29 -
 30
30 -
31
-
32
-
33
-
34
-
35
-
36
-
37
-
38
-
39
-
40
-
41
-
42
-
43
-
44
-
45
-
46
-
47
-
48
-
49
-
50
-
51
-
52
-
53
-
54
-
55
-
56
-
57
-
58
-
59
-
60
-
61
-
62
-
63
-
64
-
65
-
66
-
67
 |
 |

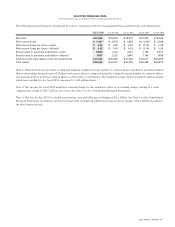
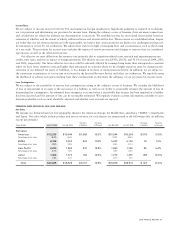
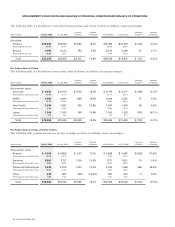
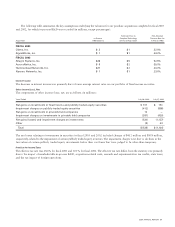
Gross Margin
The following table shows the gross margin for each theater (in millions, except percentages):
AMOUNT PERCENTAGE
Years Ended July 31, 2004 July 26, 2003 July 27, 2002 July 31, 2004 July 26, 2003 July 27, 2002
Gross margin:
Americas $ 8,274 $ 7,340 $ 6,733 67.6% 69.6% 63.2%
EMEA 4,244 3,659 3,269 69.3% 70.3% 63.8%
Asia Pacific 1,532 1,313 1,121 68.7% 70.6% 63.5%
Japan 1,076 921 890 73.9% 72.4% 65.0%
Total $15,126 $ 13,233 $ 12,013 68.6% 70.1% 63.5%
The following table shows the gross margin for products and services (in millions, except percentages):
AMOUNT PERCENTAGE
Years Ended July 31, 2004 July 26, 2003 July 27, 2002 July 31, 2004 July 26, 2003 July 27, 2002
Gross margin:
Product $12,784 $ 10,971 $ 9,755 68.9% 70.5% 62.3%
Service 2,342 2,262 2,258 67.0% 68.3% 69.6%
Total $15,126 $13,233 $12,013 68.6% 70.1% 63.5%
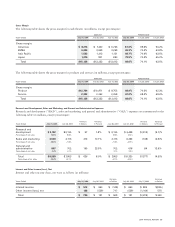
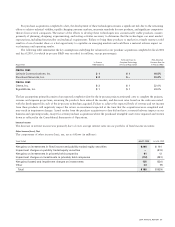
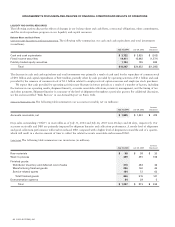
Research and Development, Sales and Marketing, and General and Administrative Expenses
Research and development (“R&D”), sales and marketing, and general and administrative (“G&A”) expenses are summarized in the
following table (in millions, except percentages):
Variance Variance Variance Variance
Years Ended July 31, 2004 July 26, 2003 in Dollars in Percent July 26, 2003 July 27, 2002 in Dollars in Percent
Research and
development $ 3,192 $3,135 $ 57 1.8% $ 3,135 $ 3,448 $ (313) (9.1)%
Percentage of net sales 14.5% 16.6% 16.6% 18.2%
Sales and marketing 4,530 4,116 414 10.1% 4,116 4,264 (148) (3.5)%
Percentage of net sales 20.6% 21.8% 21.8% 22.5%
General and
administrative 867 702 165 23.5% 702 618 84 13.6%
Percentage of net sales 3.9% 3.7% 3.7% 3.3%
Total $ 8,589 $ 7,953 $ 636 8.0% $ 7,953 $ 8,330 $ (377) (4.5)%
Percentage of net sales 39.0% 42.1% 42.1% 44.0%
Interest and Other Income (Loss), Net
Interest and other income (loss), net were as follows (in millions):
Variance Variance
Years Ended July 31, 2004 July 26, 2003 in Dollars July 26, 2003 July 27, 2002 in Dollars
Interest income $ 512 $ 660 $ (148) $ 660 $ 895 $(235)
Other income (loss), net 188 (529) 717 (529) (1,104) 575
Total $700 $ 131 $ 569 $ 131 $ (209) $ 340
2004 ANNUAL REPORT 23