Cisco 2004 Annual Report Download - page 24
Download and view the complete annual report
Please find page 24 of the 2004 Cisco annual report below. You can navigate through the pages in the report by either clicking on the pages listed below, or by using the keyword search tool below to find specific information within the annual report.-
 1
1 -
2
-
3
-
4
-
5
-
6
-
7
-
8
-
9
-
10
-
11
-
12
-
13
-
 14
14 -
 15
15 -
 16
16 -
 17
17 -
 18
18 -
 19
19 -
 20
20 -
 21
21 -
 22
22 -
 23
23 -
 24
24 -
 25
25 -
 26
26 -
 27
27 -
 28
28 -
 29
29 -
 30
30 -
 31
31 -
 32
32 -
 33
33 -
 34
34 -
35
-
36
-
37
-
38
-
39
-
40
-
41
-
42
-
43
-
44
-
45
-
46
-
47
-
48
-
49
-
50
-
51
-
52
-
53
-
54
-
55
-
56
-
57
-
58
-
59
-
60
-
61
-
62
-
63
-
64
-
65
-
66
-
67
 |
 |

For purchase acquisitions completed to date, the development of these technologies remains a significant risk due to the remaining
efforts to achieve technical viability, rapidly changing customer markets, uncertain standards for new products, and significant competitive
threats from several companies. The nature of the efforts to develop these technologies into commercially viable products consists
primarily of planning, designing, experimenting, and testing activities necessary to determine that the technologies can meet market
expectations, including functionality and technical requirements. Failure to bring these products to market in a timely manner could
result in a loss of market share or a lost opportunity to capitalize on emerging markets and could have a material adverse impact on
our business and operating results.
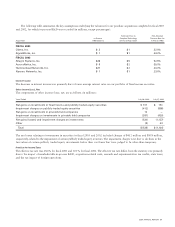
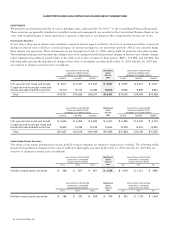
The following table summarizes the key assumptions underlying the valuation for our purchase acquisitions completed in fiscal 2004
and fiscal 2003, for which in-process R&D was recorded (in millions, except percentages):
Estimated Cost to Risk-Adjusted
In-Process Complete Technology Discount Rate for
Acquisition R&D Expense at Time of Acquisition In-Process R&D
FISCAL 2004
Latitude Communications, Inc. $ 1 $ 1 16.5%
Riverhead Networks, Inc. $ 2 $ — 23.0%
FISCAL 2003
Okena, Inc. $ 3 $ 1 22.0%
SignalWorks, Inc. $ 1 $ 1 24.0%
The key assumptions primarily consist of an expected completion date for the in-process projects; estimated costs to complete the projects;
revenue and expense projections, assuming the products have entered the market; and discount rates based on the risks associated
with the development life cycle of the in-process technology acquired. Failure to achieve the expected levels of revenue and net income
from these products will negatively impact the return on investment expected at the time that the acquisitions were completed and
may result in impairment charges. Actual results from the purchase acquisitions to date did not have a material adverse impact on our
business and operating results, except for certain purchase acquisitions where the purchased intangible assets were impaired and written
down as reflected in the Consolidated Statements of Operations.
Interest Income
The decrease in interest income was primarily due to lower average interest rates on our portfolio of fixed income securities.
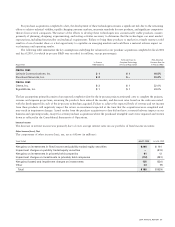
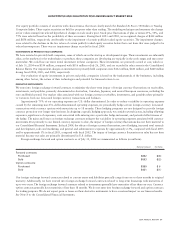
Other Income (Loss), Net
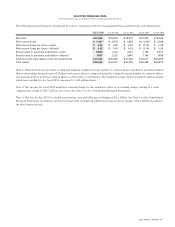
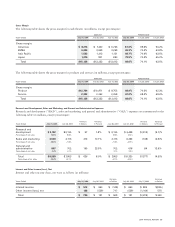
The components of other income (loss), net, are as follows (in millions):
Years Ended July 31, 2004 July 26, 2003
Net gains on investments in fixed income and publicly traded equity securities $ 206 $161
Impairment charges on publicly traded equity securities —(412)
Net gains on investments in privately held companies 61 12
Impairment charges on investments in privately held companies (112) (281)
Net gains (losses) and impairment charges on investments 155 (520)
Other 33 (9)
Total $188 $ (529)
2004 ANNUAL REPORT 27