Cisco 2004 Annual Report Download - page 57
Download and view the complete annual report
Please find page 57 of the 2004 Cisco annual report below. You can navigate through the pages in the report by either clicking on the pages listed below, or by using the keyword search tool below to find specific information within the annual report.-
 1
1 -
2
-
3
-
4
-
5
-
6
-
7
-
8
-
9
-
10
-
11
-
12
-
13
-
14
-
15
-
16
-
17
-
18
-
19
-
20
-
21
-
22
-
23
-
24
-
25
-
26
-
27
-
28
-
29
-
30
-
31
-
32
-
33
-
34
-
35
-
36
-
37
-
38
-
39
-
40
-
41
-
42
-
43
-
44
-
45
-
46
-
 47
47 -
 48
48 -
 49
49 -
 50
50 -
 51
51 -
 52
52 -
 53
53 -
 54
54 -
 55
55 -
 56
56 -
 57
57 -
 58
58 -
 59
59 -
 60
60 -
 61
61 -
 62
62 -
 63
63 -
 64
64 -
 65
65 -
 66
66 -
 67
67
 |
 |

60 CISCO SYSTEMS, INC.60 CISCO SYSTEMS, INC.60 CISCO SYSTEMS, INC.60 CISCO SYSTEMS, INC.60 CISCO SYSTEMS, INC.60 CISCO SYSTEMS, INC.60 CISCO SYSTEMS, INC.60 CISCO SYSTEMS, INC.60 CISCO SYSTEMS, INC.60 CISCO SYSTEMS, INC.60 CISCO SYSTEMS, INC.
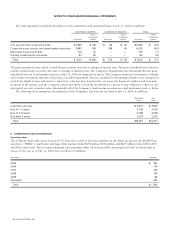
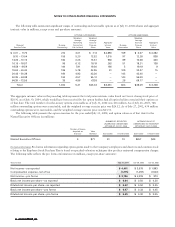
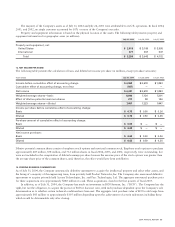
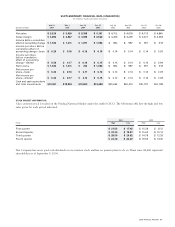
The following table summarizes significant ranges of outstanding and exercisable options as of July 31, 2004 (shares and aggregate
intrinsic value in millions, except years and per-share amounts):
OPTIONS OUTSTANDING OPTIONS EXERCISABLE
Weighted- Weighted- Weighted-
Average Average Average
Remaining Exercise Aggregate Exercise Aggregate
Number Contractual Price per Intrinsic Number Price per Intrinsic
Outstanding Life (in Years) Share Value Exercisable Share Value
$ 0.01 – 9.75 210 3.61 $ 7.13 $ 2,896 159 $ 6.57 $ 2,282
9.76 – 13.04 156 5.20 12.52 1,310 97 12.28 838
13.05 – 16.15 180 6.25 15.61 956 89 15.68 466
16.16 – 18.57 96 6.12 18.19 262 51 18.21 138
18.58 – 19.59 144 7.91 19.56 196 5 19.19 9
19.60 – 26.42 185 5.78 22.95 31 109 24.37 15
26.43 – 50.38 184 4.93 43.30 — 145 42.46 —
50.39 – 64.38 160 4.57 55.12 — 140 55.09 —
64.39 – 72.56 35 4.86 67.28 — 28 69.17 —
Total 1,350 5.41 $25.34 $ 5,651 823 $28.09 $ 3,748
The aggregate intrinsic value in the preceding table represents the total pretax intrinsic value based on Cisco’s closing stock price of
$20.92 as of July 30, 2004, which would have been received by the option holders had all option holders exercised their options as
of that date. The total number of in-the-money options exercisable as of July 31, 2004 was 436 million. As of July 26, 2003, 748
million outstanding options were exercisable, and the weighted average exercise price was $26.12. As of July 27, 2002, 634 million
outstanding options were exercisable, and the weighted average exercise price was $23.51.
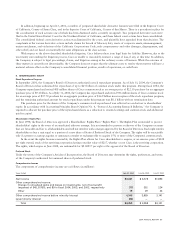
The following table presents the option exercises for the year ended July 31, 2004, and option values as of that date for the
Named Executive Officers (in millions):
NUMBER OF SECURITIES INTRINSIC VALUE OF
UNDERLYING UNEXERCISED UNEXERCISED IN-THE-MONEY
OPTIONS AT JULY 31, 2004 OPTIONS AT JULY 31, 2004
Number of Shares
Acquired on Value
Exercise Realized Exercisable Unexercisable Exercisable Unexercisable
Named Executive Officers 4 $71 41 13 $257 $44
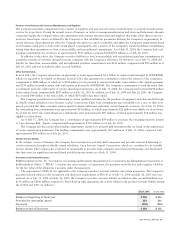
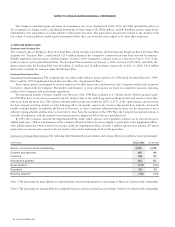
Pro forma Information Pro forma information regarding option grants made to the Company’s employees and directors and common stock
relating to the Employee Stock Purchase Plan is based on specified valuation techniques that produce estimated compensation charges.
The following table reflects the pro forma information (in millions, except per-share amounts):
Years Ended July 31, 2004 July 26, 2003 July 27, 2002
Net income—as reported $ 4,401 $ 3,578 $ 1,893
Compensation expense, net of tax (1,215) (1,259) (1,520)
Net income—pro forma $ 3,186 $ 2,319 $ 373
Basic net income per share—as reported $0.64 $ 0.50 $ 0.26
Diluted net income per share—as reported $ 0.62 $ 0.50 $ 0.25
Basic net income per share—pro forma $ 0.47 $ 0.33 $ 0.05
Diluted net income per share—pro forma $ 0.45 $ 0.32 $ 0.05
60 CISCO SYSTEMS, INC.
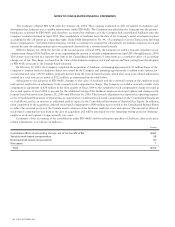
NOTES TO CONSOLIDATED FINANCIAL STATEMENTS
Range of
Exercise Prices