Cisco 2004 Annual Report Download - page 29
Download and view the complete annual report
Please find page 29 of the 2004 Cisco annual report below. You can navigate through the pages in the report by either clicking on the pages listed below, or by using the keyword search tool below to find specific information within the annual report.-
 1
1 -
2
-
3
-
4
-
5
-
6
-
7
-
8
-
9
-
10
-
11
-
12
-
13
-
14
-
15
-
16
-
17
-
18
-
 19
19 -
 20
20 -
 21
21 -
 22
22 -
 23
23 -
 24
24 -
 25
25 -
 26
26 -
 27
27 -
 28
28 -
 29
29 -
 30
30 -
 31
31 -
 32
32 -
 33
33 -
 34
34 -
 35
35 -
 36
36 -
 37
37 -
 38
38 -
 39
39 -
40
-
41
-
42
-
43
-
44
-
45
-
46
-
47
-
48
-
49
-
50
-
51
-
52
-
53
-
54
-
55
-
56
-
57
-
58
-
59
-
60
-
61
-
62
-
63
-
64
-
65
-
66
-
67
 |
 |

LIQUIDITY AND CAPITAL RESOURCES
The following sections discuss the effects of changes in our balance sheet and cash flows, contractual obligations, other commitments,
and the stock repurchase program on our liquidity and capital resources.
Balance Sheet and Cash Flows
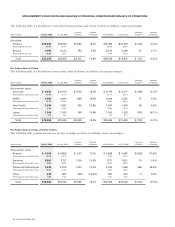
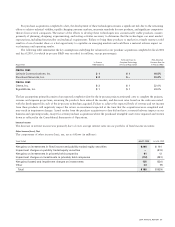
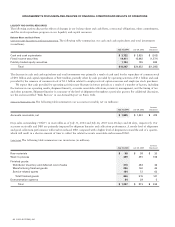
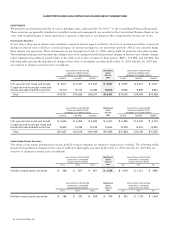
Cash and Cash Equivalents and Total Investments The following table summarizes our cash and cash equivalents and total investments
(in millions):
Increase
July 31, 2004 July 26, 2003 (Decrease)
Cash and cash equivalents $ 3,722 $ 3,925 $ (203)
Fixed income securities 14,411 15,982 (1,571)
Publicly traded equity securities 1,134 745 389
Total $19,267 $20,652 $(1,385)
The decrease in cash and cash equivalents and total investments was primarily a result of cash used for the repurchase of common stock
of $9.1 billion and capital expenditures of $613 million, partially offset by cash provided by operating activities of $7.1 billion and cash
provided by the issuance of common stock of $1.3 billion related to employee stock option exercises and employee stock purchases.
We expect that cash provided by operating activities may fluctuate in future periods as a result of a number of factors, including
fluctuations in our operating results, shipment linearity, accounts receivable collections, inventory management, and the timing of tax
and other payments. Shipment linearity is a measure of the level of shipments throughout a particular quarter. For additional discussion,
see the section entitled “Risk Factors” in our Annual Report on Form 10-K.
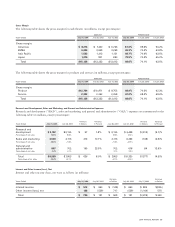
Accounts Receivable, Net The following table summarizes our accounts receivable, net (in millions):
Increase
July 31, 2004 July 26, 2003 (Decrease)
Accounts receivable, net $ 1,825 $ 1,351 $ 474
Days sales outstanding (“DSO”) in receivables as of July 31, 2004 and July 26, 2003 were 28 days and 26 days, respectively. Our
accounts receivable and DSO are primarily impacted by shipment linearity and collections performance. A steady level of shipments
and good collections performance will result in reduced DSO compared with a higher level of shipments toward the end of a quarter,
which will result in a shorter amount of time to collect the related accounts receivable and increased DSO.
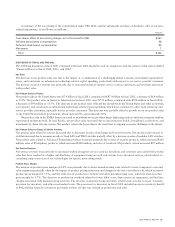
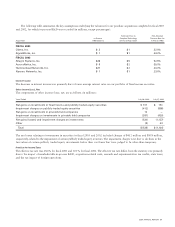
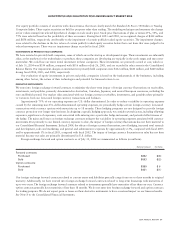
Inventories The following table summarizes our inventories (in millions):
Increase
July 31, 2004 July 26, 2003 (Decrease)
Raw materials $58 $ 38 $ 20
Work in process 459 291 168
Finished goods:
Distributor inventory and deferred cost of sales 316 283 33
Manufacturing finished goods 206 160 46
Service-related spares 134 72 62
Total finished goods 656 515141
Demonstration systems 34 29 5
Total $ 1,207 $ 873 $ 334
32 CISCO SYSTEMS, INC.
MANAGEMENT’S DISCUSSION AND ANALYSIS OF FINANCIAL CONDITION AND RESULTS OF OPERATIONS