Cisco 2004 Annual Report Download - page 21
Download and view the complete annual report
Please find page 21 of the 2004 Cisco annual report below. You can navigate through the pages in the report by either clicking on the pages listed below, or by using the keyword search tool below to find specific information within the annual report.-
 1
1 -
2
-
3
-
4
-
5
-
6
-
7
-
8
-
9
-
10
-
 11
11 -
 12
12 -
 13
13 -
 14
14 -
 15
15 -
 16
16 -
 17
17 -
 18
18 -
 19
19 -
 20
20 -
 21
21 -
 22
22 -
 23
23 -
 24
24 -
 25
25 -
 26
26 -
 27
27 -
 28
28 -
 29
29 -
 30
30 -
 31
31 -
32
-
33
-
34
-
35
-
36
-
37
-
38
-
39
-
40
-
41
-
42
-
43
-
44
-
45
-
46
-
47
-
48
-
49
-
50
-
51
-
52
-
53
-
54
-
55
-
56
-
57
-
58
-
59
-
60
-
61
-
62
-
63
-
64
-
65
-
66
-
67
 |
 |

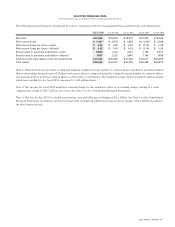
DISCUSSION OF FISCAL 2004 AND 2003
The following discussion of fiscal 2004 compared with fiscal 2003 should be read in conjunction with the section of this report entitled
“Financial Data for Fiscal 2004, 2003, and 2002.”
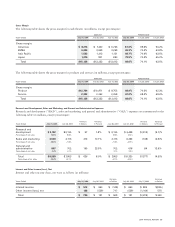
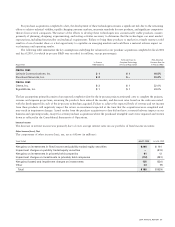
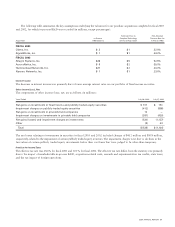
Net Sales
The increase in net product sales was due to the impact of a gradual recovery in the global economic environment coupled with increased
information technology-related capital spending in our enterprise, service provider, commercial, and consumer markets. The increase
in net product sales occurred across all geographic theaters with the Americas and EMEA theaters, contributing approximately 82.0%
of the total increase. The majority of the increase in net product sales was related to higher sales of Advanced Technology products,
which contributed approximately 47.9% of the total increase, and higher sales of switches, which contributed approximately 38.9%
of the total increase. The increase in service revenue was primarily due to increased technical support service contract initiations and
renewals associated with product sales.
Fiscal 2004 had 53 weeks, compared with 52 weeks in fiscal 2003, and we believe that this extra week may have had a positive
impact on our sales in fiscal 2004. However, we are not able to quantify the effect of the slightly longer year on our revenue.
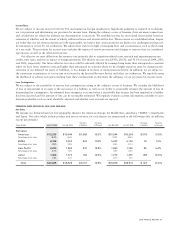
Net Product Sales by Theater
Net product sales in the Americas theater consist of net product sales in the United States and Americas International, which includes
Canada, Mexico, and Latin America. Net product sales in the Americas theater increased due to sales of home networking products
increasing by approximately $513 million as a result of our acquisition of the Linksys business in the fourth quarter of fiscal 2003.
The remainder of the increase in net product sales in the Americas theater was primarily due to an increase in net product sales to
enterprise customers and the United States federal government. The increase in net product sales to enterprise customers was due to the
impact of a gradual recovery in the economic environment coupled with increased information technology-related capital spending.
Net product sales to the United States federal government increased by approximately 20% due to higher program capital spending
in the defense sector.
Net product sales in the EMEA theater increased primarily as a result of continued product deployment by service providers and
growth in enterprise markets, especially in the public sector. The increase in net product sales in the EMEA theater occurred primarily
in the United Kingdom, Germany, the Netherlands, and Russia.
In Asia Pacific, net product sales increased primarily as a result of infrastructure builds, broadband acceleration, and investments
by Asian telecom carriers. The growth was primarily in the service provider and enterprise markets in China, Korea, and India. Net
product sales in the Japan theater increased primarily as a result of growth in the service provider market.
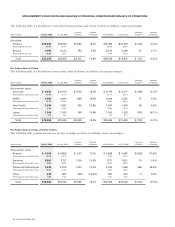
Net Product Sales by Groups of Similar Products
Routers The increase in net product sales related to routers was attributable to sales of high-end routers, which increased by $556 million
primarily as a result of higher spending by service providers, partially offset by a decline in sales of midrange routers and low-end
routers, which decreased by $47 million. The decrease in midrange and low-end routers was primarily due to the increased size of the
default memory in our basic configurations, which resulted in fewer customers needing to purchase lower-end routers to augment
their memory.
Switches The increase in net product sales related to switches was primarily due to sales of LAN modular switches, which increased
by $632 million, and LAN fixed switches, which increased by $618 million, partially offset by sales of WAN switches, which decreased
by $90 million. The increase in sales of LAN switches was a result of new technologies being implemented by our customers, which
resulted in higher sales of our modular switches, Cisco Catalyst 6500 and Catalyst 4500 platforms and fixed configuration switches,
including the Cisco Catalyst 3750 platform, introduced in the fourth quarter of fiscal 2003, and the Cisco Catalyst 3550 platform. The
decline in sales of WAN switches was due to the continued technology migration away from Asynchronous Transfer Mode (ATM)
to Internet Protocol (IP).
24 CISCO SYSTEMS, INC.
MANAGEMENT’S DISCUSSION AND ANALYSIS OF FINANCIAL CONDITION AND RESULTS OF OPERATIONS