Cisco 2004 Annual Report Download - page 35
Download and view the complete annual report
Please find page 35 of the 2004 Cisco annual report below. You can navigate through the pages in the report by either clicking on the pages listed below, or by using the keyword search tool below to find specific information within the annual report.
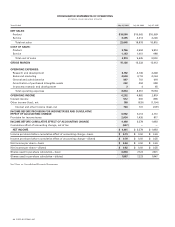
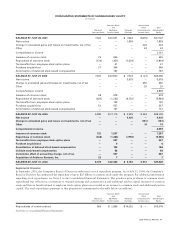
Years Ended July 31, 2004 July 26, 2003 July 27, 2002
NET SALES:
Product $18,550 $15,565 $15,669
Service 3,495 3,313 3,246
Total net sales 22,045 18,878 18,915
COST OF SALES:
Product 5,766 4,594 5,914
Service 1,153 1,051 988
Total cost of sales 6,919 5,645 6,902
GROSS MARGIN 15,126 13,233 12,013
OPERATING EXPENSES:
Research and development 3,192 3,135 3,448
Sales and marketing 4,530 4,116 4,264
General and administrative 867 702 618
Amortization of purchased intangible assets 242 394 699
In-process research and development 3465
Total operating expenses 8,834 8,351 9,094
OPERATING INCOME 6,292 4,882 2,919
Interest income 512 660 895
Other income (loss), net 188 (529) (1,104)
Interest and other income (loss), net 700131 (209)
INCOME BEFORE PROVISION FOR INCOME TAXES AND CUMULATIVE
EFFECT OF ACCOUNTING CHANGE 6,992 5,013 2,710
Provision for income taxes 2,024 1,435 817
INCOME BEFORE CUMULATIVE EFFECT OF ACCOUNTING CHANGE 4,968 3,578 1,893
Cumulative effect of accounting change, net of tax (567) ——
NET INCOME $ 4,401 $ 3,578 $ 1,893
Income per share before cumulative effect of accounting change—basic $ 0.73 $ 0.50 $ 0.26
Income per share before cumulative effect of accounting change—diluted $0.70 $ 0.50 $ 0.25
Net income per share—basic $ 0.64 $ 0.50 $ 0.26
Net income per share—diluted $0.62 $0.50 $0.25
Shares used in per-share calculation—basic 6,840 7,124 7,301
Shares used in per-share calculation—diluted 7,057 7,223 7,447
See Notes to Consolidated Financial Statements.
38 CISCO SYSTEMS, INC.
CONSOLIDATED STATEMENTS OF OPERATIONS
(in millions, except per-share amounts)


