Cisco 2004 Annual Report Download - page 27
Download and view the complete annual report
Please find page 27 of the 2004 Cisco annual report below. You can navigate through the pages in the report by either clicking on the pages listed below, or by using the keyword search tool below to find specific information within the annual report.-
 1
1 -
2
-
3
-
4
-
5
-
6
-
7
-
8
-
9
-
10
-
11
-
12
-
13
-
14
-
15
-
16
-
 17
17 -
 18
18 -
 19
19 -
 20
20 -
 21
21 -
 22
22 -
 23
23 -
 24
24 -
 25
25 -
 26
26 -
 27
27 -
 28
28 -
 29
29 -
 30
30 -
 31
31 -
 32
32 -
 33
33 -
 34
34 -
 35
35 -
 36
36 -
 37
37 -
38
-
39
-
40
-
41
-
42
-
43
-
44
-
45
-
46
-
47
-
48
-
49
-
50
-
51
-
52
-
53
-
54
-
55
-
56
-
57
-
58
-
59
-
60
-
61
-
62
-
63
-
64
-
65
-
66
-
67
 |
 |

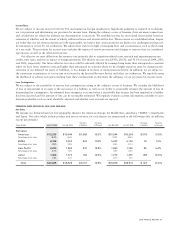
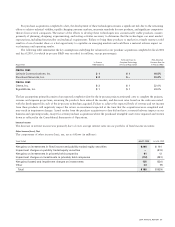
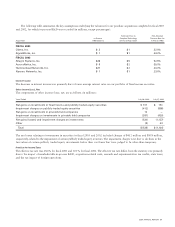
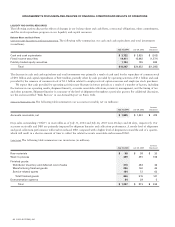
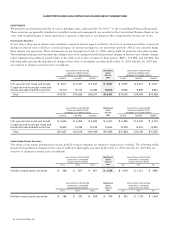
Service Gross Margin
Service gross margin decreased by 1.3% but increased $4 million in absolute dollars. Service gross margin will typically experience
some variability over time due to various factors such as the change in mix between technical support services and advanced services, as
well as the timing of technical support service contract initiations and renewals.
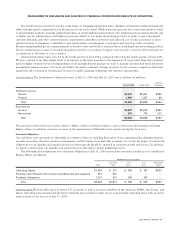
Research and Development, Sales and Marketing, and General and Administrative Expenses
R&D expenses decreased primarily due to a decrease in expenditures on prototypes of approximately $120 million due, in part, to
our ongoing cost control measures. The decrease in R&D expenses was also due to lower depreciation on lab equipment and other
reduced discretionary spending. Sales and marketing expenses decreased due to a decrease in sales expenses of $176 million partially
offset by an increase in marketing expenses of $28 million. The decrease in sales expenses was due to lower expenses related to our
sales programs and other reduced discretionary spending. In addition, we experienced a decrease in the size of our sales force during
fiscal 2003. Our marketing expenses increased as we have continued to invest in both our new growth market opportunities and our
branding strategy. During fiscal 2003, we invested approximately $98 million in a new marketing campaign. G&A expenses
increased primarily due to real estate allocations.
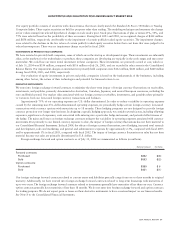
In the third quarter of fiscal 2001, we announced a restructuring program to prioritize our initiatives around a focus on profit
contribution, high-growth areas of our business, reduction of expenses, and improved efficiency. This restructuring program included
a worldwide workforce reduction, consolidation of excess facilities, and restructuring of certain business functions. For additional
information regarding the restructuring program, see Note 4 to the Consolidated Financial Statements. During fiscal 2003, we increased
the restructuring liabilities related to the consolidation of excess facilities and other charges by $45 million, which was recorded during
the first quarter and fourth quarter of fiscal 2003, due to changes in real estate market conditions. The increase in restructuring liabilities
was recorded as expenses related to R&D ($18 million), sales and marketing ($18 million), G&A ($4 million), and cost of sales
($5 million). During fiscal 2002, we increased the restructuring liabilities related to the consolidation of excess facilities and other charges
by $93 million, which was recorded in the third quarter of fiscal 2002, due to changes in real estate market conditions. The increase
in restructuring liabilities was recorded as expenses related to R&D ($39 million), sales and marketing ($42 million), G&A ($8 million),
and cost of sales ($4 million). There can be no assurance that future changes in real estate market conditions will not result in additional
real estate liabilities.
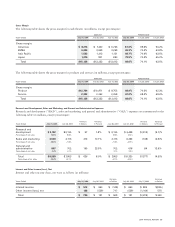
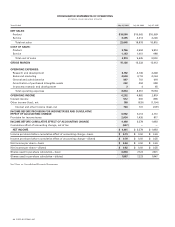
Amortization of Purchased Intangible Assets
Amortization of purchased intangible assets included in operating expenses was $394 million in fiscal 2003, compared with $699 million
in fiscal 2002. The decrease in the amortization of purchased intangible assets was primarily due to the accelerated amortization for
certain technology and patent intangibles in the fiscal 2002 period and a decrease in the write-down of certain technology and patent
intangibles. The write-down of certain technology and patent intangibles in fiscal 2003 was $49 million, compared with $159 million
in fiscal 2002. The write-downs of certain technology and patent intangibles were related to a decrease in the expected future cash flows
for these purchased intangible assets. For additional information regarding purchased intangible assets, see Note 3 to the Consolidated
Financial Statements.
In-Process Research and Development
In-process R&D expense in fiscal 2003 was $4 million, compared with $65 million in fiscal 2002. See Note 3 to the Consolidated
Financial Statements for additional information regarding the acquisitions completed in fiscal 2003 and 2002 and the in-process R&D
recorded for each acquisition. The amounts expensed to in-process R&D were expensed upon acquisition because technological feasibility
had not been established and no future alternative uses existed.
30 CISCO SYSTEMS, INC.
MANAGEMENT’S DISCUSSION AND ANALYSIS OF FINANCIAL CONDITION AND RESULTS OF OPERATIONS