Cisco 2004 Annual Report Download - page 30
Download and view the complete annual report
Please find page 30 of the 2004 Cisco annual report below. You can navigate through the pages in the report by either clicking on the pages listed below, or by using the keyword search tool below to find specific information within the annual report.-
 1
1 -
2
-
3
-
4
-
5
-
6
-
7
-
8
-
9
-
10
-
11
-
12
-
13
-
14
-
15
-
16
-
17
-
18
-
19
-
 20
20 -
 21
21 -
 22
22 -
 23
23 -
 24
24 -
 25
25 -
 26
26 -
 27
27 -
 28
28 -
 29
29 -
 30
30 -
 31
31 -
 32
32 -
 33
33 -
 34
34 -
 35
35 -
 36
36 -
 37
37 -
 38
38 -
 39
39 -
 40
40 -
41
-
42
-
43
-
44
-
45
-
46
-
47
-
48
-
49
-
50
-
51
-
52
-
53
-
54
-
55
-
56
-
57
-
58
-
59
-
60
-
61
-
62
-
63
-
64
-
65
-
66
-
67
 |
 |

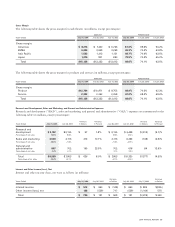
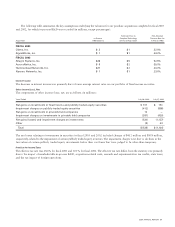
The overall increase in inventory was due to the impact of managing targeted lead times, changes in anticipated customer demands and
other customer-specific requirements, and the increase in our total revenue. Work-in-process increased due to increased inventory levels
of subassemblies needed to manage targeted lead times on certain high-demand products. Our finished goods increased primarily due
to higher service-related spares and higher inventories related to our home networking products in order to meet anticipated
customer demands, and other customer-specific requirements. Distributor inventory and deferred cost of sales are related to unrec-
ognized revenue on shipments to distributors and retail partners and shipments to enterprise and service provider customers.
Manufacturing finished goods consist primarily of build-to-order and build-to-stock products, including home networking products.
Service-related spares consist of reusable equipment related to our technical support and warranty activities. All inventories are
accounted for at the lower of cost or market.
Annualized inventory turns were 6.4 in the fourth quarter of fiscal 2004, compared with 6.8 in the fourth quarter of fiscal 2003.
We may continue to see these higher levels of inventories in the short term due to the expansion of our product lines and continued
need for higher inventory levels of subassemblies of certain high-demand products in order to manage customer lead times. Inventory
management remains an area of focus as we balance the need to maintain strategic inventory levels to ensure competitive lead times
against the risk of inventory obsolescence because of rapidly changing technology and customer requirements.
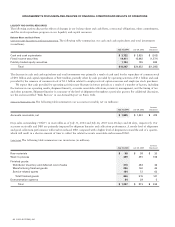
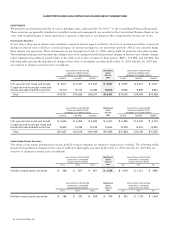
Deferred Revenue The breakdown of deferred revenue at July 31, 2004 and July 26, 2003 was as follows (in millions):
Increase
July 31, 2004 July 26, 2003 (Decrease)
Deferred revenue:
Service $3,047 $2,451 $ 596
Product 1,455 1,357 98
Total $4,502 $3,808 $ 694
Reported as:
Current $3,527 $3,034 $ 493
Noncurrent 975 774 201
Total $4,502 $3,808 $ 694
The increase in deferred service revenue reflects a higher volume of technical support contract initiations and renewals, including
higher volume of multiyear contracts, in excess of the amortization of deferred service revenue during the fiscal year.
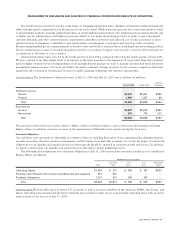
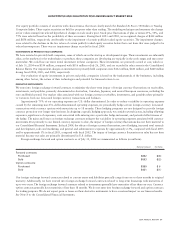
Contractual Obligations
Our cash flows from operations are dependent on a number of factors, including fluctuations in our operating results, shipment linearity,
accounts receivable collections, inventory management, and the timing of tax and other payments. As a result, the impact of contractual
obligations on our liquidity and capital resources in future periods should be analyzed in conjunction with such factors. In addition,
we plan for and measure our liquidity and capital resources through an annual budgeting process.
The following table summarizes our contractual obligations at July 31, 2004 and excludes amounts recorded in our Consolidated
Balance Sheets (in millions):
PAYMENTS DUE BY PERIOD
Less than 1–3 3–5 More than
Total 1 Year Years Years 5 Years
Operating leases $1,356 $ 231 $ 306 $ 187 $ 632
Purchase commitments with contract manufacturers and suppliers 951 951 — — —
Purchase obligations 1,121 631 343 147 —
Total $3,428 $1,813 $ 649 $ 334 $ 632
Operating Leases We lease office space in several U.S. locations, as well as locations elsewhere in the Americas, EMEA, Asia Pacific, and
Japan. Operating lease amounts include future minimum lease payments under all our noncancelable operating leases with an initial
term in excess of one year as of July 31, 2004.
2004 ANNUAL REPORT 33
MANAGEMENT’S DISCUSSION AND ANALYSIS OF FINANCIAL CONDITION AND RESULTS OF OPERATIONS