Cisco 2004 Annual Report Download - page 28
Download and view the complete annual report
Please find page 28 of the 2004 Cisco annual report below. You can navigate through the pages in the report by either clicking on the pages listed below, or by using the keyword search tool below to find specific information within the annual report.-
 1
1 -
2
-
3
-
4
-
5
-
6
-
7
-
8
-
9
-
10
-
11
-
12
-
13
-
14
-
15
-
16
-
17
-
 18
18 -
 19
19 -
 20
20 -
 21
21 -
 22
22 -
 23
23 -
 24
24 -
 25
25 -
 26
26 -
 27
27 -
 28
28 -
 29
29 -
 30
30 -
 31
31 -
 32
32 -
 33
33 -
 34
34 -
 35
35 -
 36
36 -
 37
37 -
 38
38 -
39
-
40
-
41
-
42
-
43
-
44
-
45
-
46
-
47
-
48
-
49
-
50
-
51
-
52
-
53
-
54
-
55
-
56
-
57
-
58
-
59
-
60
-
61
-
62
-
63
-
64
-
65
-
66
-
67
 |
 |

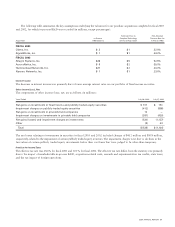
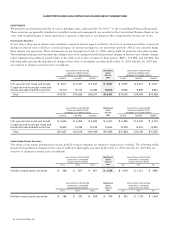
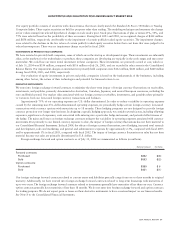
The following table summarizes the key assumptions underlying the valuation for our purchase acquisitions completed in fiscal 2003
and 2002, for which in-process R&D was recorded (in millions, except percentages):
Estimated Cost to Risk-Adjusted
In-Process Complete Technology Discount Rate for
Acquisition R&D Expense at Time of Acquisition In-Process R&D
FISCAL 2003
Okena, Inc. $ 3 $1 22.0%
SignalWorks, Inc. $ 1 $1 24.0%
FISCAL 2002
Allegro Systems, Inc. $28 $5 52.5%
AuroraNetics, Inc. $ 9 $2 35.0%
Hammerhead Networks, Inc. $27 $2 23.0%
Navarro Networks, Inc. $ 1 $1 23.0%
Interest Income
The decrease in interest income was primarily due to lower average interest rates on our portfolio of fixed income securities.
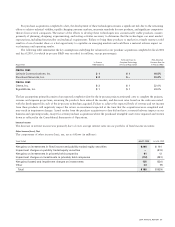
Other Income (Loss), Net
The components of other income (loss), net, are as follows (in millions):
Years Ended July 26, 2003 July 27, 2002
Net gains on investments in fixed income and publicly traded equity securities $ 161 $ 151
Impairment charges on publicly traded equity securities (412) (858)
Net gains on investments in privately held companies 12 —
Impairment charges on investments in privately held companies (281) (420)
Net gains (losses) and impairment charges on investments (520) (1,127)
Other (9) 23
Total $(529) $ (1,104)
The net losses relating to investments in securities in fiscal 2003 and 2002 included charges of $412 million and $858 million,
respectively, related to the impairment of certain publicly traded equity securities. The impairment charges were due to declines in the
fair values of certain publicly traded equity investments below their cost basis that were judged to be other-than-temporary.
Provision for Income Taxes
The effective tax rate was 28.6% for fiscal 2003 and 30.1% for fiscal 2002. The effective tax rate differs from the statutory rate primarily
due to the impact of nondeductible in-process R&D, acquisition-related costs, research and experimentation tax credits, state taxes,
and the tax impact of foreign operations.
2004 ANNUAL REPORT 31