Cisco 2004 Annual Report Download - page 19
Download and view the complete annual report
Please find page 19 of the 2004 Cisco annual report below. You can navigate through the pages in the report by either clicking on the pages listed below, or by using the keyword search tool below to find specific information within the annual report.-
 1
1 -
2
-
3
-
4
-
5
-
6
-
7
-
8
-
 9
9 -
 10
10 -
 11
11 -
 12
12 -
 13
13 -
 14
14 -
 15
15 -
 16
16 -
 17
17 -
 18
18 -
 19
19 -
 20
20 -
 21
21 -
 22
22 -
 23
23 -
 24
24 -
 25
25 -
 26
26 -
 27
27 -
 28
28 -
 29
29 -
30
-
31
-
32
-
33
-
34
-
35
-
36
-
37
-
38
-
39
-
40
-
41
-
42
-
43
-
44
-
45
-
46
-
47
-
48
-
49
-
50
-
51
-
52
-
53
-
54
-
55
-
56
-
57
-
58
-
59
-
60
-
61
-
62
-
63
-
64
-
65
-
66
-
67
 |
 |

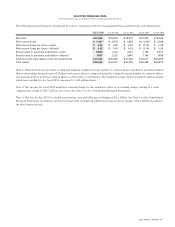
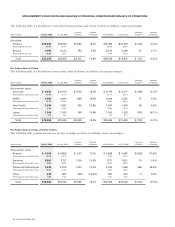
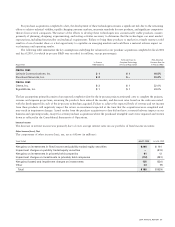
The following table is a breakdown of net sales between product and service revenue (in millions, except percentages):
Variance Variance Variance Variance
Years Ended July 31, 2004 July 26, 2003 in Dollars in Percent July 26, 2003 July 27, 2002 in Dollars in Percent
Net sales:
Product $ 18,550 $15,565 $2,985 19.2% $15,565 $15,669 $ (104) (0.7)%
Percentage of net sales 84.1% 82.5% 82.5% 82.8%
Service 3,495 3,313 182 5.5% 3,313 3,246 67 2.1%
Percentage of net sales 15.9% 17.5% 17.5% 17.2%
Total $ 22,045 $18,878 $ 3,167 16.8% $18,878 $18,915 $ (37) (0.2)%
Net Product Sales by Theater
The following table is a breakdown of net product sales by theater (in millions, except percentages):
Variance Variance Variance Variance
Years Ended July 31, 2004 July 26, 2003 in Dollars in Percent July 26, 2003 July 27, 2002 in Dollars in Percent
Net product sales:
Americas $ 9,662 $ 8,109 $1,553 19.2% $ 8,109 $ 8,277 $ (168) (2.0)%
Percentage of net product sales 52.1% 52.1% 52.1% 52.7%
EMEA 5,504 4,609 895 19.4% 4,609 4,537 72 1.6%
Percentage of net product sales 29.7% 29.6% 29.6% 29.0%
Asia Pacific 2,039 1,687 352 20.9% 1,687 1,593 94 5.9%
Percentage of net product sales 11.0% 10.8% 10.8% 10.2%
Japan 1,345 1,160 185 15.9% 1,160 1,262 (102) (8.1)%
Percentage of net product sales 7.2% 7.5% 7.5% 8.1%
Total $ 18,550 $15,565 $2,985 19.2% $15,565 $15,669 $ (104) (0.7)%
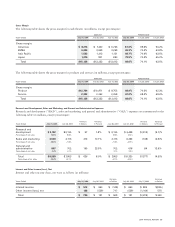
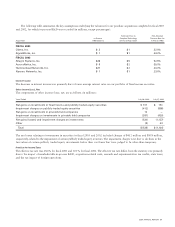
Net Product Sales by Groups of Similar Products
The following table presents net sales for groups of similar products (in millions, except percentages):
Variance Variance Variance Variance
Years Ended July 31, 2004 July 26, 2003 in Dollars in Percent July 26, 2003 July 27, 2002 in Dollars in Percent
Net product sales:
Routers $ 5,406 $ 4,859 $ 547 11.3% $ 4,859 $ 5,487 $ (628) (11.4)%
Percentage of net product sales 29.1% 31.2% 31.2% 35.0%
Switches 8,881 7,721 1,160 15.0% 7,721 7,651 70 0.9%
Percentage of net product sales 47.9% 49.6% 49.6% 48.8%
Advanced Technologies 3,435 2,004 1,431 71.4% 2,004 1,556 448 28.8%
Percentage of net product sales 18.5% 12.9% 12.9% 10.0%
Other 828 981 (153) (15.6)% 981 975 6 0.6%
Percentage of net product sales 4.5% 6.3% 6.3% 6.2%
Total $ 18,550 $15,565 $2,985 19.2% $15,565 $15,669 $ (104) (0.7)%
22 CISCO SYSTEMS, INC.
MANAGEMENT’S DISCUSSION AND ANALYSIS OF FINANCIAL CONDITION AND RESULTS OF OPERATIONS