CarMax 2007 Annual Report Download - page 70
Download and view the complete annual report
Please find page 70 of the 2007 CarMax annual report below. You can navigate through the pages in the report by either clicking on the pages listed below, or by using the keyword search tool below to find specific information within the annual report.-
 1
1 -
2
-
3
-
4
-
5
-
6
-
7
-
8
-
9
-
10
-
11
-
12
-
13
-
14
-
15
-
16
-
17
-
18
-
19
-
20
-
21
-
22
-
23
-
24
-
25
-
26
-
27
-
28
-
29
-
30
-
31
-
32
-
33
-
34
-
35
-
36
-
37
-
38
-
39
-
40
-
41
-
42
-
43
-
44
-
45
-
46
-
47
-
48
-
49
-
50
-
51
-
52
-
53
-
54
-
55
-
56
-
57
-
58
-
59
-
 60
60 -
 61
61 -
 62
62 -
 63
63 -
 64
64 -
 65
65 -
 66
66 -
 67
67 -
 68
68 -
 69
69 -
 70
70 -
 71
71 -
 72
72 -
 73
73 -
 74
74 -
 75
75 -
 76
76 -
 77
77 -
 78
78 -
 79
79 -
 80
80 -
81
-
82
-
83
 |
 |
60
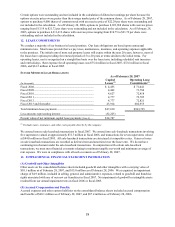
uncorrected as of the beginning of the fiscal year of adoption. SAB 108 was effective for the current fiscal year
ending February 28, 2007. The adoption of this statement did not have a material impact on our financial position,
results of operations, or cash flows.
In February 2007, the FASB issued SFAS No. 159, “The Fair Value Option for Financial Assets and Financial
Liabilities – Including an amendment of FASB Statement No. 115” (“SFAS 159”), which permits all entities to
choose to measure many financial instruments and certain other items at fair value and consequently report
unrealized gains and losses on these items in earnings. SFAS 159 will be effective for our fiscal year beginning
March 1, 2008. We are currently evaluating the impact of adopting SFAS 159 on our financial position, results of
operations, and cash flows.
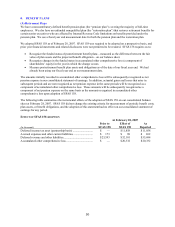
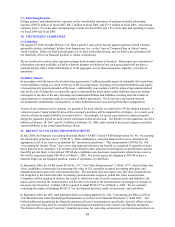
16. SELECTED QUARTERLY FINANCIAL DATA (UNAUDITED)
First Quarter Second Quarter Third Quarter Fourth Quarter Fiscal Year
(In thousands except
p
er share data) 2007 2007 2007 2007 2007
Net sales and operating
revenues................................... $ 1,885,139 $ 1,929,542 $ 1,768,147 $ 1,882,828 $ 7,465,656
Gross profit................................. $ 248,255 $ 253,365 $ 228,609 $ 240,833 $ 971,062
CarMax Auto Finance income.. $ 32,394 $ 36,512 $ 31,974 $ 31,745 $ 132,625
Selling, general, and
administrative expenses ........ $ 186,966 $ 200,049 $ 187,318 $ 201,835 $ 776,168
Net earnings ............................... $ 56,776 $ 54,264 $ 45,419 $ 42,138 $ 198,597
Net earnings per share:
Basic ...................................... $ 0.27 $ 0.26 $ 0.21 $ 0.20 $ 0.93
Diluted ................................... $ 0.27 $ 0.25 $ 0.21 $ 0.19 $ 0.92
First Quarter Second Quarter Third Quarter Fourth Quarter Fiscal Year
(In thousands except
p
er share data) 2006 2006 2006 2006 2006
Net sales and operating
revenues................................... $ 1,578,360 $ 1,633,853 $ 1,423,980 $ 1,623,774 $ 6,259,967
Gross profit................................. $ 197,759 $ 208,584 $ 177,173 $ 207,198 $ 790,714
CarMax Auto Finance income.. $ 27,071 $ 23,824 $ 27,971 $ 25,461 $ 104,327
Selling, general, and
administrative expenses ........ $ 163,765 $ 171,401 $ 167,351 $ 171,853 $ 674,370
Net earnings ............................... $ 36,980 $ 37,636 $ 22,931 $ 36,673 $ 134,220
Net earnings per share:
Basic ...................................... $ 0.18 $ 0.18 $ 0.11 $ 0.17 $ 0.64
Diluted ................................... $ 0.17 $ 0.18 $ 0.11 $ 0.17 $ 0.63