CarMax 2007 Annual Report Download - page 29
Download and view the complete annual report
Please find page 29 of the 2007 CarMax annual report below. You can navigate through the pages in the report by either clicking on the pages listed below, or by using the keyword search tool below to find specific information within the annual report.-
 1
1 -
2
-
3
-
4
-
5
-
6
-
7
-
8
-
9
-
10
-
11
-
12
-
13
-
14
-
15
-
16
-
17
-
18
-
 19
19 -
 20
20 -
 21
21 -
 22
22 -
 23
23 -
 24
24 -
 25
25 -
 26
26 -
 27
27 -
 28
28 -
 29
29 -
 30
30 -
 31
31 -
 32
32 -
 33
33 -
 34
34 -
 35
35 -
 36
36 -
 37
37 -
 38
38 -
 39
39 -
40
-
41
-
42
-
43
-
44
-
45
-
46
-
47
-
48
-
49
-
50
-
51
-
52
-
53
-
54
-
55
-
56
-
57
-
58
-
59
-
60
-
61
-
62
-
63
-
64
-
65
-
66
-
67
-
68
-
69
-
70
-
71
-
72
-
73
-
74
-
75
-
76
-
77
-
78
-
79
-
80
-
81
-
82
-
83
 |
 |
19
We target a similar dollar amount of gross profit per used unit, regardless of retail price. Used unit sales growth is
our primary focus. We plan to open used car superstores at a rate of approximately 15% to 20% of our used car
superstore base each year. In fiscal 2008, we plan to open 13 superstores, expanding our store base by
approximately 17%. Over the long term, we expect comparable store used unit sales increases to average in the
range of 4% to 8%, reflecting the multi-year ramp in sales at newly opened stores as they mature, continued market
share gains at stores that have reached basic maturity sales levels, which we estimate occurs in a store’ s fifth year of
operation, and underlying industry sales growth.
The principal challenges we face in expanding our store base include our ability to build our management bench
strength to support the store growth and our ability to procure suitable real estate at reasonable costs. We staff each
newly opened store with an experienced management team. We must therefore continually recruit, train, and
develop managers and associates to fill the pipeline necessary to support future store openings. If at any time we
believed that the rate of store growth was causing our performance to falter, we would consider slowing the growth
rate.
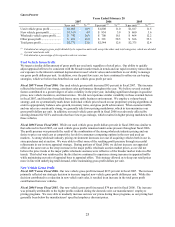
Fiscal 2007 Highlights
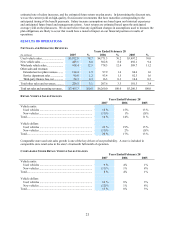
• Net sales and operating revenues increased 19% to $7.47 billion from $6.26 billion in fiscal 2006, while net
earnings increased 48% to $198.6 million, or $0.92 per share, from $134.2 million, or $0.63 per share.
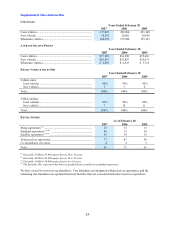
• Total used vehicle unit sales increased 16%, reflecting the combination of our 9% increase in comparable store
used unit sales and the growth in our store base.
• Total wholesale vehicle unit sales increased 16%, consistent with our used vehicle unit sales growth.
• We opened ten used car superstores in fiscal 2007, including five standard superstores and five satellite
superstores.
• Our total gross profit per unit increased to $2,731 from $2,544 in fiscal 2006. We realized improvements in
gross profit per unit in all categories, including used vehicles, new vehicles, wholesale vehicles, and other. We
believe our used vehicle gross profit benefited from our strong, consistent sales performance, which resulted in
fewer pricing markdowns being made, as well as a more stable underlying economic environment.
• CAF income increased 27% to $132.6 million from $104.3 million in fiscal 2006. The improvement reflected
the growth in retail vehicle sales and managed receivables, an improvement in the gain on loans originated and
sold, and an increase in the average amount financed. CAF income included a benefit of $13.0 million, or
$0.04 per share for favorable items, primarily valuation adjustments of our retained interest, in fiscal 2007,
compared with a benefit of $15.2 million, or $0.04 per share in fiscal 2006.
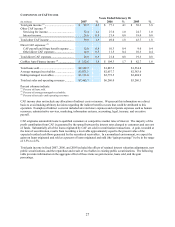
• Selling, general, and administrative expenses as a percent of net sales and operating revenues (the “SG&A
ratio”) declined to 10.4% from 10.8% in fiscal 2006. We benefited from the leverage of fixed expenses
generated by our strong comparable store sales growth.
• As a result of adopting SFAS 123(R) in fiscal 2007, we recognized share-based compensation expense of $0.09
per share in fiscal 2007 compared with $0.07 per share in fiscal 2006, as restated. The fiscal 2007 expense
includes costs of $0.02 per share resulting from the retirement of our former chief executive officer.
• Net cash provided by operations increased to $136.8 million from $117.5 million in fiscal 2006, primarily
reflecting the improved net earnings offset by increased investment in working capital.
CRITICAL ACCOUNTING POLICIES
Our results of operations and financial condition as reflected in the consolidated financial statements have been
prepared in accordance with U.S. generally accepted accounting principles. Preparation of financial statements
requires management to make estimates and assumptions affecting the reported amounts of assets, liabilities,
revenues, expenses, and the disclosures of contingent assets and liabilities. We use our historical experience and
other relevant factors when developing our estimates and assumptions. We continually evaluate these estimates and
assumptions. Note 2 includes a discussion of significant accounting policies. The accounting policies discussed
below are the ones we consider critical to an understanding of our consolidated financial statements because their
application places the most significant demands on our judgment. Our financial results might have been different if
different assumptions had been used or other conditions had prevailed.
Securitization Transactions
We use a securitization program to fund substantially all of the automobile loan receivables originated by CAF. The
securitization transactions are accounted for as sales. A gain, recorded at the time of the securitization transaction,