CarMax 2007 Annual Report Download - page 32
Download and view the complete annual report
Please find page 32 of the 2007 CarMax annual report below. You can navigate through the pages in the report by either clicking on the pages listed below, or by using the keyword search tool below to find specific information within the annual report.-
 1
1 -
2
-
3
-
4
-
5
-
6
-
7
-
8
-
9
-
10
-
11
-
12
-
13
-
14
-
15
-
16
-
17
-
18
-
19
-
20
-
21
-
 22
22 -
 23
23 -
 24
24 -
 25
25 -
 26
26 -
 27
27 -
 28
28 -
 29
29 -
 30
30 -
 31
31 -
 32
32 -
 33
33 -
 34
34 -
 35
35 -
 36
36 -
 37
37 -
 38
38 -
 39
39 -
 40
40 -
 41
41 -
 42
42 -
43
-
44
-
45
-
46
-
47
-
48
-
49
-
50
-
51
-
52
-
53
-
54
-
55
-
56
-
57
-
58
-
59
-
60
-
61
-
62
-
63
-
64
-
65
-
66
-
67
-
68
-
69
-
70
-
71
-
72
-
73
-
74
-
75
-
76
-
77
-
78
-
79
-
80
-
81
-
82
-
83
 |
 |

22
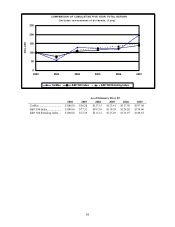
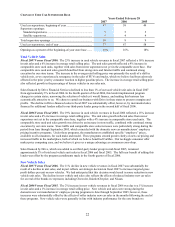
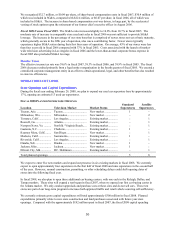
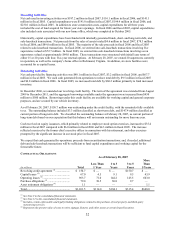
CHANGE IN USED CAR SUPERSTORE BASE
Years Ended February 28
2007 2006 2005
Used car superstores, beginning of year .................................... 67 58 49
Superstore openings:
Standard superstores .............................................................. 5 5 5
Satellite superstores................................................................ 5 4 4
Total superstore openings.......................................................... 10 9 9
Used car superstores, end of year .............................................. 77 67 58
Openings as a percent of the beginning-of-year store base ....... 15% 16% 18%
Used Vehicle Sales
Fiscal 2007 Versus Fiscal 2006. The 23% increase in used vehicle revenues in fiscal 2007 reflected a 16% increase
in unit sales and a 6% increase in average retail selling price. The unit sales growth reflected a 9% increase in
comparable store used units, together with sales from newer superstores not yet in the comparable store base. Our
comparable store used unit sales growth benefited from strong store and Internet traffic and continued strong
execution by our store teams. The increase in the average retail selling price was primarily the result of a shift in
vehicle mix, as we experienced a resurgence in the sales of SUVs and trucks, which we believe had been adversely
affected in the prior year by consumer reaction to higher gasoline prices. The increase in average retail selling price
also reflected growth in the percentage of luxury vehicles in our sales mix.
Sales financed by Drive Financial Services declined to less than 1% of our used vehicle unit sales in fiscal 2007
from approximately 3% in fiscal 2006. In the fourth quarter of fiscal 2006, this lender implemented program
changes in certain states, narrowing the selection of vehicles it would finance, and making this business less
economically attractive to us. We chose to curtail our business with Drive in these states to preserve margins and
profits. The decline in Drive-financed sales in fiscal 2007 was substantially offset, however, by incremental sales
financed by additional lenders added to our third-party lender group in the second half of fiscal 2006.
Fiscal 2006 Versus Fiscal 2005. The 19% increase in used vehicle revenues in fiscal 2006 reflected a 15% increase
in unit sales and a 4% increase in average retail selling price. The unit sales growth reflected sales from newer
superstores not yet in the comparable store base, together with a 4% increase in comparable store used units. The
comparable store used unit sales growth was driven by an increase in store traffic, combined with continued strong
execution by our store teams. Store traffic and comparable store sales increases were particularly strong during the
period from June through September 2005, which coincided with the domestic new car manufacturers’ employee
pricing incentive programs. Under these programs, the manufacturers established specific “employee” prices,
available to all consumers, for each make and model. These programs created greater clarity on new car pricing and
increased traffic in the marketplace, both of which we believe benefited CarMax. Our no-haggle consumer offer
makes price comparing easy, and we believe it gives us a unique advantage as consumers cross-shop.
Sales financed by Drive, which was added to our third-party lender group in mid-fiscal 2005, remained
approximately 3% of total used vehicle unit sales in fiscal 2006 and fiscal 2005. The full-year benefit of adding this
lender was offset by the program curtailments made in the fourth quarter of fiscal 2006.
New Vehicle Sales
Fiscal 2007 Versus Fiscal 2006. The 11% decline in new vehicle revenues in fiscal 2007 was substantially the
result of a decline in unit sales, and in part reflects our strategic decision in fiscal 2007 to increase targeted gross
profit dollars per unit on new vehicles. We had anticipated that this decision would result in some reduction in new
vehicle unit sales. The decline in new vehicle unit sales also reflects the effects of reduced industry new car sales
for several of the brands we represent, including Chevrolet, DaimlerChrysler, and Nissan.
Fiscal 2006 Versus Fiscal 2005. The 2% increase in new vehicle revenues in fiscal 2006 was due to a 1% increase
in unit sales and a 1% increase in average retail selling price. New vehicle unit sales were strong during the
domestic new car manufacturers’ employee pricing programs in June through September 2005; however, these
increases were substantially offset by the effects of softer industry new car sales in the months following the end of
these programs. New vehicle sales were generally in line with industry performance for the core brands we