CarMax 2007 Annual Report Download - page 50
Download and view the complete annual report
Please find page 50 of the 2007 CarMax annual report below. You can navigate through the pages in the report by either clicking on the pages listed below, or by using the keyword search tool below to find specific information within the annual report.-
 1
1 -
2
-
3
-
4
-
5
-
6
-
7
-
8
-
9
-
10
-
11
-
12
-
13
-
14
-
15
-
16
-
17
-
18
-
19
-
20
-
21
-
22
-
23
-
24
-
25
-
26
-
27
-
28
-
29
-
30
-
31
-
32
-
33
-
34
-
35
-
36
-
37
-
38
-
39
-
 40
40 -
 41
41 -
 42
42 -
 43
43 -
 44
44 -
 45
45 -
 46
46 -
 47
47 -
 48
48 -
 49
49 -
 50
50 -
 51
51 -
 52
52 -
 53
53 -
 54
54 -
 55
55 -
 56
56 -
 57
57 -
 58
58 -
 59
59 -
 60
60 -
61
-
62
-
63
-
64
-
65
-
66
-
67
-
68
-
69
-
70
-
71
-
72
-
73
-
74
-
75
-
76
-
77
-
78
-
79
-
80
-
81
-
82
-
83
 |
 |
40
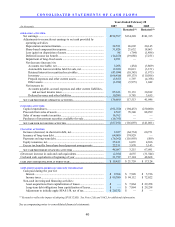
CONSOLIDATED STATEMENTS OF CASH FLOWS
Years Ended February 28
(In thousands) 2007 2006 2005
Restated (1) Restated (1)
OPERATING ACTIVITIES:
Net earnings ........................................................................................... $198,597 $134,220 $101,315
Adjustments to reconcile net earnings to net cash provided by
operating activities:
Depreciation and amortization............................................................ 34,551 26,692 20,145
Share-based compensation expense.................................................... 31,826 21,632 18,063
Loss (gain) on disposition of assets.................................................... 88 (764) (1,486)
Deferred income tax benefit ............................................................... (14,169) (19,088) (7,251)
Impairment of long-lived assets ......................................................... 4,891 — —
Net decrease (increase) in:
Accounts receivable, net ................................................................. 5,208 (454) (3,809)
Automobile loan receivables held for sale, net ............................... (2,023) 18,013 (3,371)
Retained interest in securitized receivables .................................... (43,994) (10,345) (1,975)
Inventory......................................................................................... (166,416) (93,133) (110,506)
Prepaid expenses and other current assets ...................................... (3,857) 1,797 (4,358)
Other assets..................................................................................... (3,924) (5,975) 1,042
Net increase in:
Accounts payable, accrued expenses and other current liabilities,
and accrued income taxes.......................................................... 85,633 35,133 30,382
Deferred revenue and other liabilities ............................................. 10,389 9,785 3,655
NET CASH PROVIDED BY OPERATING ACTIVITIES........................................... 136,800 117,513 41,846
INVESTING ACTIVITIES:
Capital expenditures............................................................................... (191,760) (194,433) (230,080)
Proceeds from sales of assets................................................................. 4,569 78,340 88,999
Sales of money market securities........................................................... 16,765 — —
Purchases of investment securities available-for-sale ............................ (16,765) — —
NET CASH USED IN INVESTING ACTIVITIES .................................................... (187,191) (116,093) (141,081)
FINANCING ACTIVITIES:
Increase (decrease) in short-term debt, net............................................. 2,827 (64,734) 60,751
Issuance of long-term debt..................................................................... 64,000 174,929 —
Payments on long-term debt................................................................... (76,362) (116,993) (509)
Equity issuances, net.............................................................................. 35,411 6,035 4,306
Excess tax benefits from share-based payment arrangements................ 22,211 3,978 3,143
NET CASH PROVIDED BY FINANCING ACTIVITIES ........................................... 48,087 3,215 67,691
(Decrease) increase in cash and cash equivalents...................................... (2,304) 4,635 (31,544)
Cash and cash equivalents at beginning of year ........................................ 21,759 17,124 48,668
CASH AND CASH EQUIVALENTS AT END OF YEAR ............................................... $ 19,455 $ 21,759 $ 17,124
SUPPLEMENTAL DISCLOSURES OF CASH FLOW INFORMATION
Cash paid during the year for:
Interest................................................................................................ $ 9,768 $ 7,928 $ 5,726
Income taxes....................................................................................... $ 99,380 $ 94,112 $ 72,022
Non-cash investing and financing activities:
Asset acquisitions from capitalization of leases ................................. $ — $ 7,864 $ 29,258
Long-term debt obligations from capitalization of leases................... $ — $ 7,864 $ 29,258
Adjustment to initially apply SFAS 158, net of tax............................ $ 20,332 $ — $ —
(1) Restated to reflect the impact of adopting SFAS 123(R). See Notes 2(A) and 10(C) for additional information.
See accompanying notes to consolidated financial statements.