CarMax 2007 Annual Report Download - page 39
Download and view the complete annual report
Please find page 39 of the 2007 CarMax annual report below. You can navigate through the pages in the report by either clicking on the pages listed below, or by using the keyword search tool below to find specific information within the annual report.-
 1
1 -
2
-
3
-
4
-
5
-
6
-
7
-
8
-
9
-
10
-
11
-
12
-
13
-
14
-
15
-
16
-
17
-
18
-
19
-
20
-
21
-
22
-
23
-
24
-
25
-
26
-
27
-
28
-
 29
29 -
 30
30 -
 31
31 -
 32
32 -
 33
33 -
 34
34 -
 35
35 -
 36
36 -
 37
37 -
 38
38 -
 39
39 -
 40
40 -
 41
41 -
 42
42 -
 43
43 -
 44
44 -
 45
45 -
 46
46 -
 47
47 -
 48
48 -
 49
49 -
50
-
51
-
52
-
53
-
54
-
55
-
56
-
57
-
58
-
59
-
60
-
61
-
62
-
63
-
64
-
65
-
66
-
67
-
68
-
69
-
70
-
71
-
72
-
73
-
74
-
75
-
76
-
77
-
78
-
79
-
80
-
81
-
82
-
83
 |
 |
29
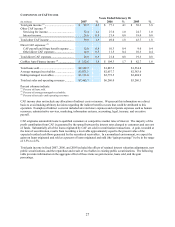
Fiscal 2006 Versus Fiscal 2005. CAF income rose 26% to $104.3 million in fiscal 2006. The fiscal 2006 total gain
income benefited from the growth in retail vehicle sales and a substantial increase in other gain income, partially
offset by a modest decline in the gain percentage to 3.5% from 3.7% in fiscal 2005. The increases in other CAF
income and direct CAF expenses in fiscal 2006 were proportionate to the growth in managed receivables during the
year.
Other gain income was $15.2 million in fiscal 2006 compared with $3.3 million in fiscal 2005. In fiscal 2005,
approximately half of the other gain income related to favorable valuation adjustments, and the remainder primarily
resulted from the repurchase and resale of receivables in existing public securitizations.
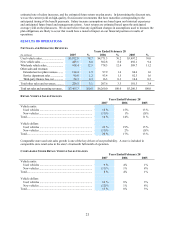
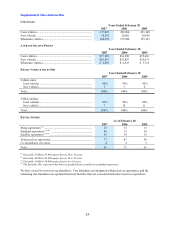
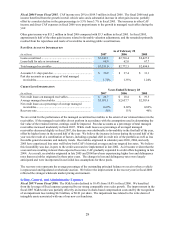
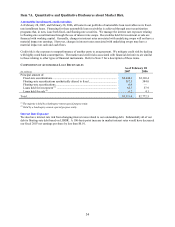
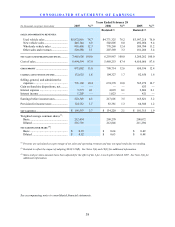
PAST DUE ACCOUNT INFORMATION
As of February 28
(In millions) 2007 2006 2005
Loans securitized ...................................................................... $ 3,242.1 $ 2,710.4 $ 2,427.2
Loans held for sale or investment............................................. 68.9 62.0 67.7
Total managed receivables ....................................................... $ 3,311.0 $ 2,772.5 $ 2,494.9
Accounts 31+ days past due ..................................................... $ 56.9 $ 37.4 $ 31.1
Past due accounts as a percentage of total managed
receivables............................................................................. 1.72% 1.35% 1.24%
CREDIT LOSS INFORMATION
Years Ended February 28
(In millions) 2007 2006 2005
Net credit losses on managed receivables................................ $ 20.7 $ 18.4 $ 19.5
Average managed receivables ................................................. $ 3,071.1 $ 2,657.7 $ 2,383.6
Net credit losses as a percentage of average managed
receivables............................................................................ 0.67% 0.69% 0.82%
Recovery rate........................................................................... 51% 51% 46%
We are at risk for the performance of the managed securitized receivables to the extent of our retained interest in the
receivables. If the managed receivables do not perform in accordance with the assumptions used in determining the
fair value of the retained interest, earnings could be impacted. Past due accounts as a percentage of total managed
receivables increased moderately in fiscal 2007. While credit losses as a percentage of averaged managed
receivables decreased slightly in fiscal 2007, the decrease was attributable to favorability in the first half of the year,
offset by higher losses in the second half of the year. We believe the increase in losses during the second half of the
year was the result of a combination of factors, including a gradual shift in credit mix of the portfolio as well as less
favorable general economic and industry trends. Receivables originated in calendar years 2003, 2004, and early
2005 have experienced loss rates well below both CAF’ s historical averages and our targeted loss rates. We believe
this favorability was due, in part, to the credit scorecard we implemented in late 2002. As it became evident that the
scorecard was resulting in lower-than-expected loss rates, CAF gradually expanded its credit offers beginning in late
2004. As a result, receivables originated in late 2005 and 2006 have been experiencing higher loss and delinquency
rates than receivables originated in those prior years. The changes in loss and delinquency rates were largely
anticipated and were incorporated in our initial loss assumptions for these pools.
The recovery rate represents the average percentage of the outstanding principal balance we receive when a vehicle
is repossessed and liquidated at wholesale auction. We believe the improvement in the recovery rate in fiscal 2006
reflected the stronger wholesale market pricing environment.
Selling, General, and Administrative Expenses
Fiscal 2007 Versus Fiscal 2006. The SG&A ratio declined to 10.4% from 10.8% in fiscal 2006. We benefited
from the leverage of fixed expenses generated by our strong comparable store sales growth. The improvement in the
fiscal 2007 SG&A ratio was partially offset by an increase in share-based compensation costs and by the recognition
of an impairment loss totaling $4.9 million, or $0.01 per share. The impairment loss related to the write down of
intangible assets associated with one of our new car franchises.