CarMax 2007 Annual Report Download - page 2
Download and view the complete annual report
Please find page 2 of the 2007 CarMax annual report below. You can navigate through the pages in the report by either clicking on the pages listed below, or by using the keyword search tool below to find specific information within the annual report.-
 1
1 -
 2
2 -
 3
3 -
 4
4 -
 5
5 -
 6
6 -
 7
7 -
 8
8 -
 9
9 -
 10
10 -
 11
11 -
 12
12 -
 13
13 -
14
-
15
-
16
-
17
-
18
-
19
-
20
-
21
-
22
-
23
-
24
-
25
-
26
-
27
-
28
-
29
-
30
-
31
-
32
-
33
-
34
-
35
-
36
-
37
-
38
-
39
-
40
-
41
-
42
-
43
-
44
-
45
-
46
-
47
-
48
-
49
-
50
-
51
-
52
-
53
-
54
-
55
-
56
-
57
-
58
-
59
-
60
-
61
-
62
-
63
-
64
-
65
-
66
-
67
-
68
-
69
-
70
-
71
-
72
-
73
-
74
-
75
-
76
-
77
-
78
-
79
-
80
-
81
-
82
-
83
 |
 |

CARMAX 2007
1
Fiscal 2007 was an exceptionally strong year for CarMax.
A number of factors contributed to our continued success last
year, including steady improvement in our operational initia-
tives and increased traffic in our stores and on carmax.com.
As a result, we reported growth in sales and gross margins
for both retail and wholesale vehicle sales, and CarMax Auto
Finance (CAF).
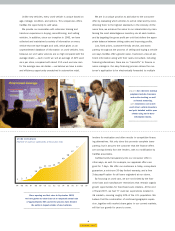
In fiscal 2007, net income increased 48% on a sales increase
of 19%, which included 9% growth in comparable store used
vehicle units. We believe our strong sales growth was fueled by
the combination of expanded CarMax brand awareness, which
drove more customers to our stores and our website, and con-
tinued excellent execution by our store teams. Sales were fur-
ther supported by a number of marketing enhancements in our
Internet, television, and radio advertising, and by a variety of
improvements to our website, carmax.com, all of which we will
continue to refine in fiscal 2008.
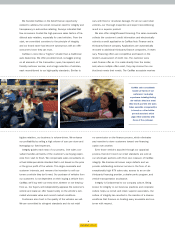
Better overall execution also helped improve our gross mar-
gins, which increased for all categories of vehicles — used, whole-
sale, and new. Better execution can be best and most simply
characterized as better vehicle buying, reconditioning, and selling.
We learn more and improve our systems each year, as we add to
our continually-expanding and industry-leading database of infor-
mation on used vehicles. We also continue to improve our whole-
sale vehicle auctions by increasing our operational efficiency and
expanding the services offered to dealer participants.
CAF income grew by 27% in fiscal 2007. CAF offers competi-
tive financing and thus provides qualifying customers with
a dependable financing option that is profitable and risk-
controlled for CarMax. For alternative financing, CarMax partners
with several strong third-party lenders. Most of these lenders pay
us a fixed fee per origination in return for loan portfolios that
we estimate are significantly less risky than their other auto
loan portfolios due to the straightforward way CarMax manages
financing and the meticulous reconditioning of our vehicles.
Our lenders benefit from the superior quality of our informa-
tion, which allows them to make better financing decisions.
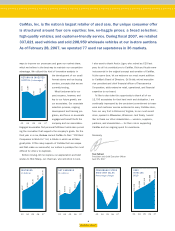
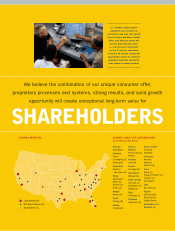
We are very excited by our future growth opportunities. The
vast size of our marketplace and our unique consumer offer
are just two of the elements that distinguish the CarMax
growth story. Although we reported $7.5 billion in revenues in
fiscal 2007 and are the largest retailer of used cars in the
United States, we still had only 77 used car superstores open
at year end, and represented only about 2% of the estimated
$290 billion market for 1- to 6- year-old used cars.
We opened 10 stores in fiscal 2007, growing our store base
by 15%, consistent with our long-term objective of 15% to 20%
annual store growth. We expect to open an additional 13 stores
in fiscal 2008, a 17% store growth rate. This rate of growth
suggests that we could double our store base in the next five
years, and have consistent, sustainable growth over the next
decade. We believe this significant growth trajectory distin-
guishes CarMax from most U.S. retailers.
We are fortunate to currently have no similar-format, multi-
market competitors, but we will never be complacent. Concept
innovation, including ongoing analysis and operational initia-
tives, is an important focus for CarMax. We constantly look for
Letter To Shareholders
Tom Folliard
President and Chief Executive Officer
FINANCIAL HIGHLIGHTS
% Change Fiscal Years Ended February 28 or 29(1)
(Dollars in millions except per share data)
’06 to’07 2007 2006 2005 2004 2003
Operating Results
Net sales and operating revenues 19% $7,465.7 $6,260.0 $5,260.3 $4,597.7 $3,969.9
Net earnings 48% $ 198.6 $ 134.2 $ 101.3 $ 109.6 $ 90.4
Diluted earnings per share 46% $ 0.92 $ 0.63 $ 0.48 $ 0.52 $ 0.43
Other Information
Cash provided by operating activities 16% $ 136.8 $ 117.5 $ 41.8 $ 141.4 $ 57.9
Used car superstores, at year-end 15% 77 67 58 49 40
(1) All per share amounts have been adjusted for the effect of the 2-for-1 stock split in March 2007. We adopted SFAS 123R in fiscal 2007, applying the modified
retrospective method, and prior year amounts have been restated for the effect of the adoption.