CarMax 2007 Annual Report Download - page 67
Download and view the complete annual report
Please find page 67 of the 2007 CarMax annual report below. You can navigate through the pages in the report by either clicking on the pages listed below, or by using the keyword search tool below to find specific information within the annual report.-
 1
1 -
2
-
3
-
4
-
5
-
6
-
7
-
8
-
9
-
10
-
11
-
12
-
13
-
14
-
15
-
16
-
17
-
18
-
19
-
20
-
21
-
22
-
23
-
24
-
25
-
26
-
27
-
28
-
29
-
30
-
31
-
32
-
33
-
34
-
35
-
36
-
37
-
38
-
39
-
40
-
41
-
42
-
43
-
44
-
45
-
46
-
47
-
48
-
49
-
50
-
51
-
52
-
53
-
54
-
55
-
56
-
 57
57 -
 58
58 -
 59
59 -
 60
60 -
 61
61 -
 62
62 -
 63
63 -
 64
64 -
 65
65 -
 66
66 -
 67
67 -
 68
68 -
 69
69 -
 70
70 -
 71
71 -
 72
72 -
 73
73 -
 74
74 -
 75
75 -
 76
76 -
 77
77 -
78
-
79
-
80
-
81
-
82
-
83
 |
 |

57
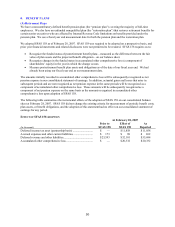
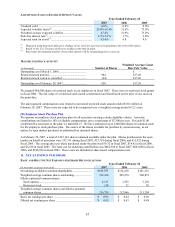
ASSUMPTIONS USED TO ESTIMATE OPTION VALUES
Years Ended February 28
2007 2006 2005
Dividend yield ........................................................................... 0.0% 0.0% 0.0%
Expected volatility factor(1)........................................................ 29.8%-63.4% 51.6% 73.0%
Weighted average expected volatility........................................ 47.4% 51.6% 73.0%
Risk-free interest rate(2).............................................................. 4.5%-5.1% 3.7% 2.8%
Expected term (in years)(3)......................................................... 4.5-4.6 4.8 4.6
(1) Measured using historical daily price changes of our stock for a period corresponding to the term of the option.
(2) Based on the U.S. Treasury yield curve in effect at the time of grant.
(3) Represents the estimated number of years that options will be outstanding prior to exercise.
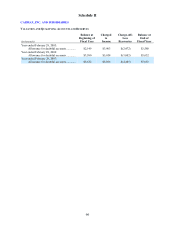
RESTRICTED STOCK ACTIVITY
(In thousands) Number of Shares
Weighted Average Grant
Date Fair Value
Outstanding as of March 1, 2006....................................... – $ –
Restricted stock granted .................................................... 984 $ 17.20
Restricted stock vested or cancelled.................................. (64) $ 17.20
Outstanding as of February 28, 2007................................. 920 $ 17.20
We granted 984,500 shares of restricted stock to our employees in fiscal 2007. There were no restricted stock grants
in fiscal 2006. The fair value of a restricted stock award is determined and fixed based on the price of our stock on
the grant date.
The unrecognized compensation costs related to nonvested restricted stock awards totaled $10.5 million at
February 28, 2007. These costs are expected to be recognized over a weighted average period of 2.1 years.
(D) Employee Stock Purchase Plan
We sponsor an employee stock purchase plan for all associates meeting certain eligibility criteria. Associate
contributions are limited to 10% of eligible compensation, up to a maximum of $7,500 per year. For each $1.00
contributed by associates to the plan, we match $0.15. We have authorized up to 4,000,000 shares of common stock
for the employee stock purchase plan. The source of the shares available for purchase by associates may, at our
option, be open market purchases or authorized but unissued shares.
At February 28, 2007, a total of 2,267,143 shares remained available under the plan. Shares purchased on the open
market on behalf of associates were 337,311 during fiscal 2007; 427,318 during fiscal 2006; and 451,922 during
fiscal 2005. The average price per share purchased under the plan was $19.32 in fiscal 2007, $14.42 in fiscal 2006,
and $12.98 in fiscal 2005. The total cost for matching contributions was $862,300 in fiscal 2007; $803,600 in fiscal
2006; and $746,700 in fiscal 2005. These costs are included in share-based compensation costs.
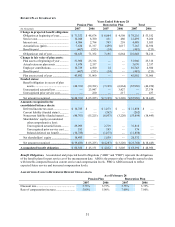
11. NET EARNINGS PER SHARE
BASIC AND DILUTIVE NET EARNINGS PER SHARE RECONCILIATIONS
Years Ended February 28
(In thousands except per share data) 2007 2006 2005
Net earnings available to common shareholders .............................. $ 198,597 $ 134,220 $ 101,315
Weighted average common shares outstanding........................ 212,454 209,270 208,072
Dilutive potential common shares:
Stock options......................................................................... 4,111 3,555 3,192
Restricted stock..................................................................... 174 21 30
Weighted average common shares and dilutive potential
common shares....................................................................... 216,739 212,846 211,294
Basic net earnings per share ...................................................... $ 0.93 $ 0.64 $ 0.49
Diluted net earnings per share ................................................... $ 0.92 $ 0.63 $ 0.48