CarMax 2007 Annual Report Download - page 38
Download and view the complete annual report
Please find page 38 of the 2007 CarMax annual report below. You can navigate through the pages in the report by either clicking on the pages listed below, or by using the keyword search tool below to find specific information within the annual report.-
 1
1 -
2
-
3
-
4
-
5
-
6
-
7
-
8
-
9
-
10
-
11
-
12
-
13
-
14
-
15
-
16
-
17
-
18
-
19
-
20
-
21
-
22
-
23
-
24
-
25
-
26
-
27
-
 28
28 -
 29
29 -
 30
30 -
 31
31 -
 32
32 -
 33
33 -
 34
34 -
 35
35 -
 36
36 -
 37
37 -
 38
38 -
 39
39 -
 40
40 -
 41
41 -
 42
42 -
 43
43 -
 44
44 -
 45
45 -
 46
46 -
 47
47 -
 48
48 -
49
-
50
-
51
-
52
-
53
-
54
-
55
-
56
-
57
-
58
-
59
-
60
-
61
-
62
-
63
-
64
-
65
-
66
-
67
-
68
-
69
-
70
-
71
-
72
-
73
-
74
-
75
-
76
-
77
-
78
-
79
-
80
-
81
-
82
-
83
 |
 |
28
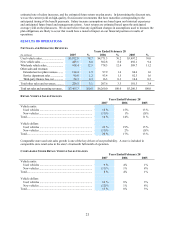
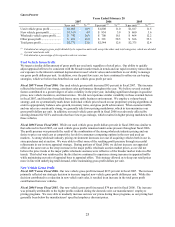
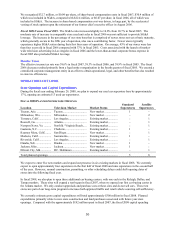
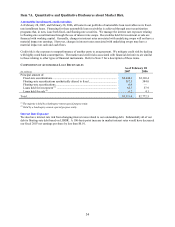
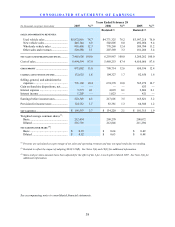
GAIN INCOME AND LOANS SOLD
Years Ended February 28
(In millions) 2007 2006 2005
Gains on sales of loans originated and sold.............................. $ 86.7 $ 61.9 $ 54.9
Other gain income .................................................................... 13.0 15.2 3.3
Total gain income ..................................................................... $ 99.7 $ 77.1 $ 58.3
Loans originated and sold......................................................... $ 2,240.2 $ 1,792.6 $ 1,483.8
Receivables repurchased from public securitizations and
resold..................................................................................... 82.5 94.8 51.0
Total loans sold......................................................................... $ 2,322.7 $ 1,887.5 $ 1,534.8
Gain percentage on loans originated and sold .......................... 3.9% 3.5% 3.7%
Total gain income as a percentage of total loans sold............... 4.3% 4.1% 3.8%
Fiscal 2007 Versus Fiscal 2006. CAF income rose 27% to $132.6 million in fiscal 2007. CAF income benefited
from the growth in retail vehicle unit sales, and increases in the gain percentage, average amount financed, and total
managed receivables. The gain percentage increased to 3.9% in fiscal 2007 from 3.5% in fiscal 2006, reflecting
changes in the interest rate environment. In fiscal 2006, our funding costs were rising faster than rates charged to
consumers resulting in a lower gain percentage. In fiscal 2007, the relative stability in our funding cost allowed us
to achieve a higher gain percentage. The increases in other CAF income and direct CAF expenses in fiscal 2007
were proportionate to the growth in managed receivables during the year.
We recognized other gain income of $13.0 million, or $0.04 per share in fiscal 2007 compared with $15.2 million,
or $0.04 per share, in fiscal 2006. In fiscal 2007, substantially all of the other gain income resulted from favorable
valuation adjustments. In fiscal 2006, other gain income included $0.03 per share of favorable valuation
adjustments, $0.01 per share of favorable effects from new public securitizations, and a favorable effect of less than
$0.01 per share from the repurchase and resale of receivables in existing public securitizations. These items are
discussed below:
• Valuation adjustments. The net favorable valuation adjustments in both fiscal 2007 and fiscal 2006
primarily resulted from lowering loss rate assumptions, mostly on pools of receivables securitized in
calendar years 2003, 2004, and 2005. We believe these pools of receivables experienced lower-than-
expected loss rates as a result of a combination of factors, including better-than-expected performance of
our new credit scorecard implemented in calendar year 2002, favorable economic conditions, operating
efficiencies resulting from systems enhancements, and an improved recovery rate.
• New public securitizations. CarMax periodically repurchases receivables from the warehouse facility and
refinances them in public securitizations. The impact of refinancing receivables can be favorable or
unfavorable depending on the relative economics of funding structures at the time the receivables are
refinanced. These transactions did not have a material impact in fiscal 2007. In fiscal 2006, we
recognized a benefit of $0.01 per share as we refinanced balances from the warehouse facility into new
public securitizations.
• Repurchase and resale of receivables. Our securitizations typically contain an option to repurchase the
securitized receivables when the outstanding balance in a pool of automobile loan receivables falls below
10% of the original pool balance. This option was exercised two times in each of fiscal 2007 and 2006. In
each case, the remaining eligible automobile loan receivables were subsequently resold into the warehouse
facility. These transactions did not have a material impact in fiscal 2007. In fiscal 2006, the spread
between the APR on the loans and the then-current funding cost in the warehouse facility resulted in an
earnings benefit.
In future years, the effect of refinancing, repurchase, and resale activity could be favorable or unfavorable depending
on the securitization structure and market conditions at the transaction date.