CarMax 2007 Annual Report Download - page 48
Download and view the complete annual report
Please find page 48 of the 2007 CarMax annual report below. You can navigate through the pages in the report by either clicking on the pages listed below, or by using the keyword search tool below to find specific information within the annual report.-
 1
1 -
2
-
3
-
4
-
5
-
6
-
7
-
8
-
9
-
10
-
11
-
12
-
13
-
14
-
15
-
16
-
17
-
18
-
19
-
20
-
21
-
22
-
23
-
24
-
25
-
26
-
27
-
28
-
29
-
30
-
31
-
32
-
33
-
34
-
35
-
36
-
37
-
 38
38 -
 39
39 -
 40
40 -
 41
41 -
 42
42 -
 43
43 -
 44
44 -
 45
45 -
 46
46 -
 47
47 -
 48
48 -
 49
49 -
 50
50 -
 51
51 -
 52
52 -
 53
53 -
 54
54 -
 55
55 -
 56
56 -
 57
57 -
 58
58 -
59
-
60
-
61
-
62
-
63
-
64
-
65
-
66
-
67
-
68
-
69
-
70
-
71
-
72
-
73
-
74
-
75
-
76
-
77
-
78
-
79
-
80
-
81
-
82
-
83
 |
 |

38
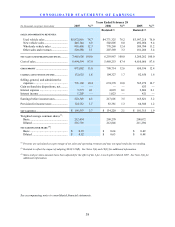
CONSOLIDATED STATEMENTS OF EARNINGS
Years Ended February 28
(In thousands except per share data) 2007 %
(1) 2006 %(1) 2005 %(1)
Restated (2) Restated (2)
SALES AND OPERATING REVENUES:
Used vehicle sales ................................ $ 5,872,816 78.7 $ 4,771,325 76.2 $ 3,997,218 76.0
New vehicle sales................................. 445,144 6.0 502,805 8.0 492,054 9.4
Wholesale vehicle sales ....................... 918,408 12.3 778,268 12.4 589,704 11.2
Other sales and revenues...................... 229,288 3.1 207,569 3.3 181,286 3.4
NET SALES AND OPERATING REVENUES.......... 7,465,656 100.0 6,259,967 100.0 5,260,262 100.0
Cost of sales............................................. 6,494,594 87.0 5,469,253 87.4 4,610,066 87.6
GROSS PROFIT ............................................ 971,062 13.0 790,714 12.6 650,196 12.4
CARMAX AUTO FINANCE INCOME .................. 132,625 1.8 104,327 1.7 82,656 1.6
Selling, general, and administrative
expenses ............................................... 776,168 10.4 674,370 10.8 565,279 10.7
Gain on franchise dispositions, net.......... — —
—
— 633
—
Interest expense ....................................... 5,373 0.1 4,093 0.1 2,806 0.1
Interest income ........................................ 1,203 — 1,023 — 421
—
Earnings before income taxes.................. 323,349 4.3 217,601 3.5 165,821 3.2
Provision for income taxes ...................... 124,752 1.7 83,381 1.3 64,506 1.2
NET EARNINGS ............................................ $ 198,597 2.7 $ 134,220 2.1 $ 101,315 1.9
Weighted average common shares(3):
Basic..................................................... 212,454 209,270 208,072
Diluted ................................................. 216,739 212,846 211,294
NET EARNINGS PER SHARE (3):
Basic..................................................... $ 0.93 $ 0.64 $ 0.49
Diluted ................................................. $ 0.92 $ 0.63 $ 0.48
(1) Percents are calculated as a percentage of net sales and operating revenues and may not equal totals due to rounding.
(2) Restated to reflect the impact of adopting SFAS 123(R). See Notes 2(A) and 10(C) for additional information.
(3) Share and per share amounts have been adjusted for the effect of the 2-for-1 stock split in March 2007. See Note 2(A) for
additional information.
See accompanying notes to consolidated financial statements.