CarMax 2007 Annual Report Download - page 37
Download and view the complete annual report
Please find page 37 of the 2007 CarMax annual report below. You can navigate through the pages in the report by either clicking on the pages listed below, or by using the keyword search tool below to find specific information within the annual report.-
 1
1 -
2
-
3
-
4
-
5
-
6
-
7
-
8
-
9
-
10
-
11
-
12
-
13
-
14
-
15
-
16
-
17
-
18
-
19
-
20
-
21
-
22
-
23
-
24
-
25
-
26
-
 27
27 -
 28
28 -
 29
29 -
 30
30 -
 31
31 -
 32
32 -
 33
33 -
 34
34 -
 35
35 -
 36
36 -
 37
37 -
 38
38 -
 39
39 -
 40
40 -
 41
41 -
 42
42 -
 43
43 -
 44
44 -
 45
45 -
 46
46 -
 47
47 -
48
-
49
-
50
-
51
-
52
-
53
-
54
-
55
-
56
-
57
-
58
-
59
-
60
-
61
-
62
-
63
-
64
-
65
-
66
-
67
-
68
-
69
-
70
-
71
-
72
-
73
-
74
-
75
-
76
-
77
-
78
-
79
-
80
-
81
-
82
-
83
 |
 |
27
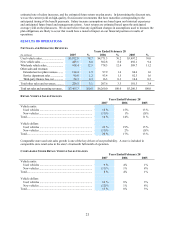
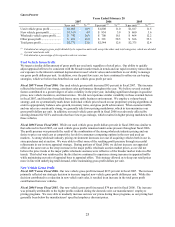
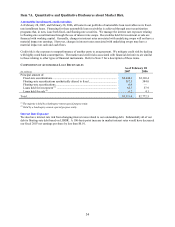
COMPONENTS OF CAF INCOME
Years Ended February 28
(In millions) 2007 % 2006 % 2005 %
Total gain income (1) ........................................ $ 99.7 4.3 $ 77.1 4.1 $ 58.3 3.8
Other CAF income: (2)
Servicing fee income.................................... 32.4 1.1 27.6 1.0 24.7 1.0
Interest income............................................. 26.6 0.9 21.4 0.8 19.0 0.8
Total other CAF income .................................. 59.0 1.9 49.0 1.8 43.7 1.8
Direct CAF expenses: (2)
CAF payroll and fringe benefit expense ...... 12.0 0.4 10.3 0.4 9.0 0.4
Other direct CAF expenses .......................... 14.0 0.5 11.5 0.4 10.3 0.4
Total direct CAF expenses............................... 26.0 0.9 21.8 0.8 19.3 0.8
CarMax Auto Finance income (3)..................... $ 132.6 1.8 $ 104.3 1.7 $ 82.7 1.6
Total loans sold................................................ $ 2,322.7 $ 1,887.5 $ 1,534.8
Average managed receivables ......................... $ 3,071.1 $ 2,657.7 $ 2,383.6
Ending managed receivables ........................... $ 3,311.0 $ 2,772.5 $ 2,494.9
Total net sales and operating revenues ............ $ 7,465.7 $ 6,260.0 $ 5,260.3
Percent columns indicate:
(1) Percent of loans sold.
(2) Percent of average managed receivables.
(3) Percent of net sales and operating revenues.
CAF income does not include any allocation of indirect costs or income. We present this information on a direct
basis to avoid making arbitrary decisions regarding the indirect benefit or costs that could be attributed to this
operation. Examples of indirect costs not included are retail store expenses and corporate expenses such as human
resources, administrative services, marketing, information systems, accounting, legal, treasury, and executive
payroll.
CAF originates automobile loans to qualified customers at competitive market rates of interest. The majority of the
profit contribution from CAF is generated by the spread between the interest rates charged to customers and our cost
of funds. Substantially all of the loans originated by CAF are sold in securitization transactions. A gain, recorded at
the time of securitization, results from recording a receivable approximately equal to the present value of the
expected residual cash flows generated by the securitized receivables. In a normalized environment, we expect the
gains on loans originated and sold as a percent of loans originated and sold (the “gain percentage”) to be in the range
of 3.5% to 4.5%.
Total gain income in fiscal 2007, 2006, and 2005 included the effects of retained interest valuation adjustments, new
public securitizations, and the repurchase and resale of receivables in existing public securitizations. The following
table provides information on the aggregate effect of these items on gain income, loans sold, and the gain
percentage.