CarMax 2007 Annual Report Download - page 62
Download and view the complete annual report
Please find page 62 of the 2007 CarMax annual report below. You can navigate through the pages in the report by either clicking on the pages listed below, or by using the keyword search tool below to find specific information within the annual report.-
 1
1 -
2
-
3
-
4
-
5
-
6
-
7
-
8
-
9
-
10
-
11
-
12
-
13
-
14
-
15
-
16
-
17
-
18
-
19
-
20
-
21
-
22
-
23
-
24
-
25
-
26
-
27
-
28
-
29
-
30
-
31
-
32
-
33
-
34
-
35
-
36
-
37
-
38
-
39
-
40
-
41
-
42
-
43
-
44
-
45
-
46
-
47
-
48
-
49
-
50
-
51
-
 52
52 -
 53
53 -
 54
54 -
 55
55 -
 56
56 -
 57
57 -
 58
58 -
 59
59 -
 60
60 -
 61
61 -
 62
62 -
 63
63 -
 64
64 -
 65
65 -
 66
66 -
 67
67 -
 68
68 -
 69
69 -
 70
70 -
 71
71 -
 72
72 -
73
-
74
-
75
-
76
-
77
-
78
-
79
-
80
-
81
-
82
-
83
 |
 |
52
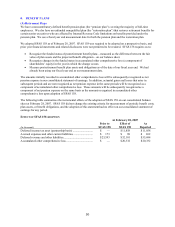
Plan Assets. The fair value of plan assets are measured using current market values. No plan assets are expected to
be returned to us during the fiscal year ended February 29, 2008.
Funding Policy. For the pension plan, we contribute amounts sufficient to meet minimum funding requirements as
set forth in the employee benefit and tax laws plus any additional amounts as we may determine to be appropriate.
We expect to contribute approximately $10 million to the pension plan in fiscal 2008. For the non-funded
restoration plan, we contribute an amount equal to the expected benefit payments.
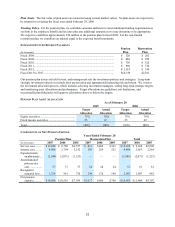
ESTIMATED FUTURE BENEFIT PAYMENTS
(In thousands)
Pension
Plan
Restoration
Plan
Fiscal 2008............................................................................................................... $ 326 $ 262
Fiscal 2009............................................................................................................... $ 484 $ 299
Fiscal 2010............................................................................................................... $ 703 $ 322
Fiscal 2011............................................................................................................... $ 999 $ 334
Fiscal 2012............................................................................................................... $ 1,314 $ 350
Fiscal 2013 to 2017.................................................................................................. $14,359 $2,011
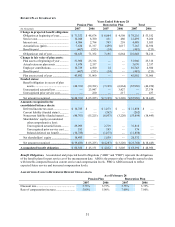
Our pension plan assets are held in trust, and management sets the investment policies and strategies. Long-term
strategic investment objectives include asset preservation and appropriately balancing risk and return. We oversee
the investment allocation process, which includes selecting investment managers, setting long-term strategic targets,
and monitoring asset allocations and performance. Target allocations are guidelines, not limitations, and
occasionally plan fiduciaries will approve allocations above or below the targets.
PENSION PLAN ASSET ALLOCATION
As of February 28
2007 2006
Target Actual Target Actual
Allocation Allocation Allocation Allocation
Equity securities ................................................ 75% 78% 75% 78%
Fixed income securities ..................................... 25 22 25 22
Total................................................................... 100% 100% 100% 100%
COMPONENTS OF NET PENSION EXPENSE
Years Ended February 28
Pension Plan Restoration Plan Total
(In thousands) 2007 2006 2005 2007 2006 2005 2007 2006 2005
Service cost.......... $ 12,048 $ 8,780 $ 6,557 $ 411 $ 480 $ 343 $ 12,459 $ 9,260 $ 6,900
Interest cost.......... 4,096 2,794 2,152 393 259 232 4,489 3,053 2,384
Expected return
on plan assets .... (2,949) (2,071) (1,523) — — — (2,949) (2,071) (1,523)
Amortization of
prior service
cost ................. 37 37 37 24 24 24 61 61 61
Recognized
actuarial loss... 1,754 961 736 249 136 149 2,003 1,097 885
Net pension
expense........... $ 14,986 $ 10,501 $ 7,959 $ 1,077 $ 899 $ 748 $ 16,063 $ 11,400 $ 8,707