CarMax 2007 Annual Report Download - page 31
Download and view the complete annual report
Please find page 31 of the 2007 CarMax annual report below. You can navigate through the pages in the report by either clicking on the pages listed below, or by using the keyword search tool below to find specific information within the annual report.-
 1
1 -
2
-
3
-
4
-
5
-
6
-
7
-
8
-
9
-
10
-
11
-
12
-
13
-
14
-
15
-
16
-
17
-
18
-
19
-
20
-
 21
21 -
 22
22 -
 23
23 -
 24
24 -
 25
25 -
 26
26 -
 27
27 -
 28
28 -
 29
29 -
 30
30 -
 31
31 -
 32
32 -
 33
33 -
 34
34 -
 35
35 -
 36
36 -
 37
37 -
 38
38 -
 39
39 -
 40
40 -
 41
41 -
42
-
43
-
44
-
45
-
46
-
47
-
48
-
49
-
50
-
51
-
52
-
53
-
54
-
55
-
56
-
57
-
58
-
59
-
60
-
61
-
62
-
63
-
64
-
65
-
66
-
67
-
68
-
69
-
70
-
71
-
72
-
73
-
74
-
75
-
76
-
77
-
78
-
79
-
80
-
81
-
82
-
83
 |
 |

21
estimated rate of salary increases, and the estimated future return on plan assets. In determining the discount rate,
we use the current yield on high-quality, fixed-income investments that have maturities corresponding to the
anticipated timing of the benefit payments. Salary increase assumptions are based upon our historical experience
and anticipated future board and management actions. Asset returns are estimated based upon the anticipated
average yield on the plan assets. We do not believe that any significant changes in assumptions used to measure the
plan obligations are likely to occur that would have a material impact on our financial position or results of
operations.
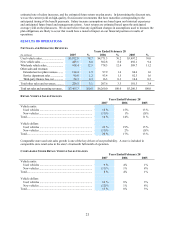
RESULTS OF OPERATIONS
NET SALES AND OPERATING REVENUES
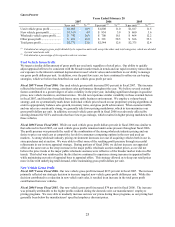
Years Ended February 28
(In millions) 2007 % 2006 % 2005 %
Used vehicle sales.............................. $5,872.8 78.7 $4,771.3 76.2 $3,997.2 76.0
New vehicle sales ................................... 445.1 6.0 502.8 8.0 492.1 9.4
Wholesale vehicle sales.......................... 918.4 12.3 778.3 12.4 589.7 11.2
Other sales and revenues:
Extended service plan revenues......... 114.4 1.5 97.9 1.6 84.6 1.6
Service department sales .................... 90.6 1.2 93.4 1.5 82.3 1.6
Third-party finance fees, net .............. 24.3 0.3 16.3 0.3 14.4 0.3
Total other sales and revenues........... 229.3 3.1 207.6 3.3 181.3 3.4
Total net sales and operating revenues .. $7,465.7 100.0 $6,260.0 100.0 $5,260.3 100.0
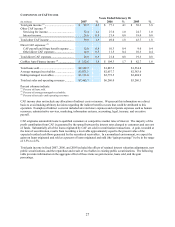
RETAIL VEHICLE SALES CHANGES
Years Ended February 28
2007 2006 2005
Vehicle units:
Used vehicles ......................................................................... 16 % 15% 13 %
New vehicles.......................................................................... (11)% 1% (5)%
Total........................................................................................... 14 % 14% 11 %
Vehicle dollars:
Used vehicles ......................................................................... 23 % 19% 15 %
New vehicles.......................................................................... (11)% 2% (5)%
Total........................................................................................... 20 % 17% 13 %
Comparable store used unit sales growth is one of the key drivers of our profitability. A store is included in
comparable store retail sales in the store’ s fourteenth full month of operation.
COMPARABLE STORE RETAIL VEHICLE SALES CHANGES
Years Ended February 28
2007 2006 2005
Vehicle units:
Used vehicles ......................................................................... 9 % 4% 1%
New vehicles.......................................................................... (11)% 1% 8%
Total........................................................................................... 8 % 4% 1%
Vehicle dollars:
Used vehicles ......................................................................... 16 % 8% 3%
New vehicles.......................................................................... (12)% 1% 8%
Total........................................................................................... 13 % 8% 3%