CarMax 2007 Annual Report Download - page 27
Download and view the complete annual report
Please find page 27 of the 2007 CarMax annual report below. You can navigate through the pages in the report by either clicking on the pages listed below, or by using the keyword search tool below to find specific information within the annual report.-
 1
1 -
2
-
3
-
4
-
5
-
6
-
7
-
8
-
9
-
10
-
11
-
12
-
13
-
14
-
15
-
16
-
 17
17 -
 18
18 -
 19
19 -
 20
20 -
 21
21 -
 22
22 -
 23
23 -
 24
24 -
 25
25 -
 26
26 -
 27
27 -
 28
28 -
 29
29 -
 30
30 -
 31
31 -
 32
32 -
 33
33 -
 34
34 -
 35
35 -
 36
36 -
 37
37 -
38
-
39
-
40
-
41
-
42
-
43
-
44
-
45
-
46
-
47
-
48
-
49
-
50
-
51
-
52
-
53
-
54
-
55
-
56
-
57
-
58
-
59
-
60
-
61
-
62
-
63
-
64
-
65
-
66
-
67
-
68
-
69
-
70
-
71
-
72
-
73
-
74
-
75
-
76
-
77
-
78
-
79
-
80
-
81
-
82
-
83
 |
 |
17
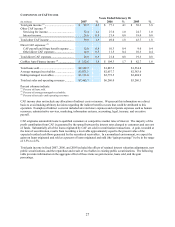
Item 6. Selected Financial Data.
FY07 FY06 FY05 FY04 FY03 FY02
Income statement information
(In millions)
Used vehicle sales ................................. $ 5,872.8 $ 4,771.3 $ 3,997.2 $ 3,470.6 $ 2,912.1 $ 2,497.2
New vehicle sales ......................................... 445.1 502.8 492.1 515.4 519.8 559.9
Wholesale vehicle sales................................ 918.4 778.3 589.7 440.6 366.6 325.6
Other sales and revenues.............................. 229.3 207.6 181.3 171.1 171.4 151.1
Net sales and operating revenues........... 7,465.7 6,260.0 5,260.3 4,597.7 3,969.9 3,533.8
Gross profit ................................................... 971.1 790.7 650.2 570.9 468.2 419.4
CarMax Auto Finance income..................... 132.6 104.3 82.7 85.0 82.4 66.5
SG&A .......................................................... 776.2 674.4 565.3 479.3 399.5 337.0
Earnings before income taxes ...................... 323.3 217.6 165.8 178.4 149.6 143.9
Provision for income taxes........................... 124.8 83.4 64.5 68.9 59.2 54.9
Net earnings.................................................. 198.6 134.2 101.3 109.6 90.4 89.1
Share and per share
information (Shares in millions)
Weighted average shares outstanding:
Basic.............................................................. 212.5 209.3 208.1 207.0 206.0 204.1
Diluted........................................................... 216.7 212.8 211.3 210.6 209.1 207.8
Net earnings per share:
Basic.............................................................. $ 0.93 $ 0.64 $ 0.49 $ 0.53 $ 0.44 $ 0.44
Diluted........................................................... $ 0.92 $ 0.63 $ 0.48 $ 0.52 $ 0.43 $ 0.43
Balance sheet information (In millions)
Total current assets....................................... $ 1,150.5 $ 941.7 $ 853.0 $ 760.5 $ 697.3 $ 577.7
Total assets.................................................... 1,885.6 1,509.6 1,306.3 1,055.1 921.7 721.9
Total current liabilities.................................. 512.0 344.9 317.8 232.2 237.7 221.1
Short-term debt............................................. 3.3 0.5 65.2 4.4 56.1 9.8
Current portion of long-term debt................ 148.4 59.8 0.3 — — 78.6
Long-term debt, excluding current portion . 33.7 134.8 128.4 100.0 100.0 —
Total shareholders’ equity............................ 1,247.4 980.1 814.2 688.0 558.6 487.1
Unit sales information
Used vehicle units sold................................. 337,021 289,888 253,168 224,099 190,135 164,062
New vehicle units sold ................................. 18,563 20,901 20,636 21,641 22,360 24,164
Wholesale vehicle units sold........................ 208,959 179,548 155,393 127,168 104,593 90,937
Percent changes in
Comparable store used vehicle unit sales.... 9 4 1 6 8 24
Total used vehicle unit sales......................... 16 15 13 18 16 23
Total net sales and operating revenues........ 19 19 14 16 12 28
Diluted net earnings per share...................... 46 31 (8) 21 — 95
Other year-end information
Used car superstores..................................... 77 67 58 49 40 35
Retail stores................................................... 81 71 61 52 44 40
Associates ..................................................... 13,736 11,712 10,815 9,355 8,263 7,196
All share and per share amounts have been adjusted for the effect of the 2-for-1 stock split in March 2007. Certain prior year
amounts have been reclassified to conform to the current year presentation. In fiscal 2007, we adopted SFAS 123(R), applying
the modified retrospective method and restating prior period amounts for the effect of the adoption. See Notes 2(A) and 10(C)
to the consolidated financial statements in Item 8 of this Form 10-K.