CarMax 2007 Annual Report Download - page 57
Download and view the complete annual report
Please find page 57 of the 2007 CarMax annual report below. You can navigate through the pages in the report by either clicking on the pages listed below, or by using the keyword search tool below to find specific information within the annual report.-
 1
1 -
2
-
3
-
4
-
5
-
6
-
7
-
8
-
9
-
10
-
11
-
12
-
13
-
14
-
15
-
16
-
17
-
18
-
19
-
20
-
21
-
22
-
23
-
24
-
25
-
26
-
27
-
28
-
29
-
30
-
31
-
32
-
33
-
34
-
35
-
36
-
37
-
38
-
39
-
40
-
41
-
42
-
43
-
44
-
45
-
46
-
 47
47 -
 48
48 -
 49
49 -
 50
50 -
 51
51 -
 52
52 -
 53
53 -
 54
54 -
 55
55 -
 56
56 -
 57
57 -
 58
58 -
 59
59 -
 60
60 -
 61
61 -
 62
62 -
 63
63 -
 64
64 -
 65
65 -
 66
66 -
 67
67 -
68
-
69
-
70
-
71
-
72
-
73
-
74
-
75
-
76
-
77
-
78
-
79
-
80
-
81
-
82
-
83
 |
 |
47
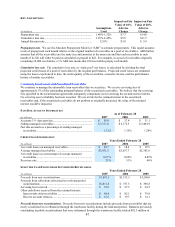
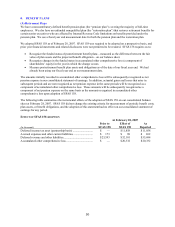
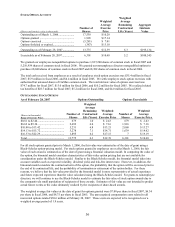
KEY ASSUMPTIONS
(In millions)
Assumptions
Used
Impact on Fair
Value of 10%
Adverse
Change
Impact on Fair
Value of 20%
Adverse
Change
Prepayment rate........................................................................ 1.40%-1.52% $ 7.7 $ 14.8
Cumulative loss rate ................................................................. 1.25%-2.45% $ 5.9 $ 11.7
Annual discount rate................................................................. 12.0% $ 3.0 $ 5.9
Prepayment rate. We use the Absolute Prepayment Model or “ABS” to estimate prepayments. This model assumes
a rate of prepayment each month relative to the original number of receivables in a pool of receivables. ABS further
assumes that all the receivables are the same size and amortize at the same rate and that each receivable in each
month of its life will either be paid as scheduled or prepaid in full. For example, in a pool of receivables originally
containing 10,000 receivables, a 1% ABS rate means that 100 receivables prepay each month.
Cumulative loss rate. The cumulative loss rate, or “static pool” net losses, is calculated by dividing the total
projected credit losses of a pool of receivables by the original pool balance. Projected credit losses are estimated
using the losses experienced to date, the credit quality of the receivables, economic factors, and the performance
history of similar receivables.
Continuing Involvement with Securitized Receivables
We continue to manage the automobile loan receivables that we securitize. We receive servicing fees of
approximately 1% of the outstanding principal balance of the securitized receivables. We believe that the servicing
fees specified in the securitization agreements adequately compensate us for servicing the securitized receivables.
No servicing asset or liability has been recorded. We are at risk for the retained interest in the securitized
receivables and, if the securitized receivables do not perform as originally projected, the value of the retained
interest would be impacted.
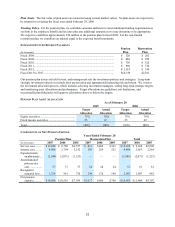
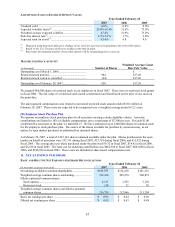
PAST DUE ACCOUNT INFORMATION
As of February 28
(In millions) 2007 2006 2005
Accounts 31+ days past due....................................................... $ 56.9 $ 37.4 $ 31.1
Ending managed receivables...................................................... $ 3,311.0 $ 2,772.5 $ 2,494.9
Past due accounts as a percentage of ending managed
receivables.............................................................................. 1.72% 1.35% 1.24%
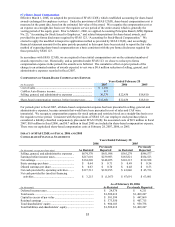
CREDIT LOSS INFORMATION
Years Ended February 28
(In millions) 2007 2006 2005
Net credit losses on managed receivables.................................. $ 20.7 $ 18.4 $ 19.5
Average managed receivables ................................................... $ 3,071.1 $ 2,657.7 $ 2,383.6
Net credit losses as a percentage of average managed
receivables.............................................................................. 0.67% 0.69% 0.82%
Recovery rate............................................................................. 51% 51% 46%
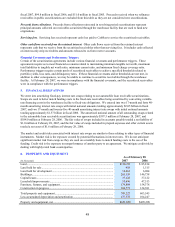
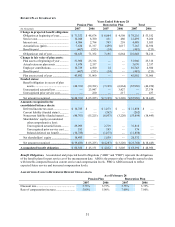
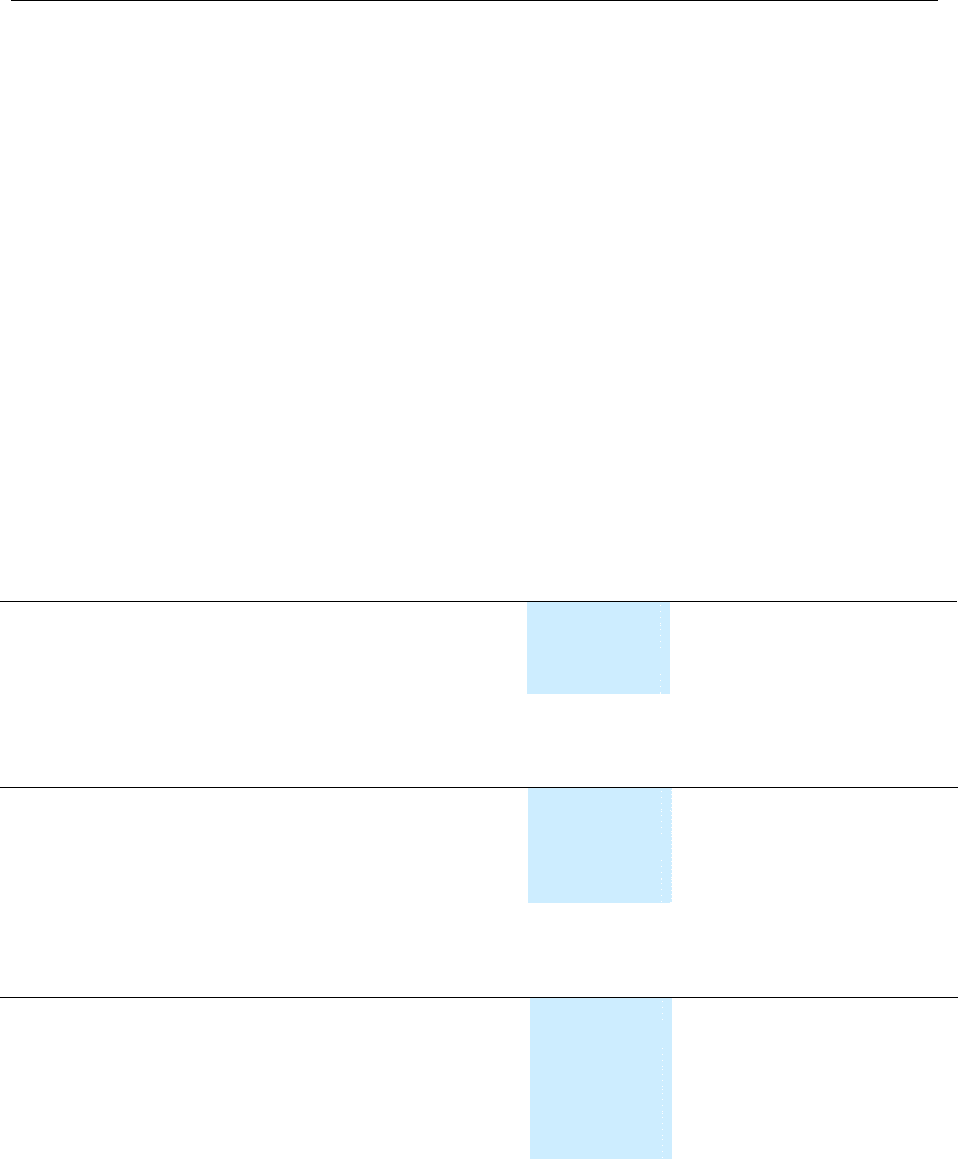
SELECTED CASH FLOWS FROM SECURITIZED RECEIVABLES
Years Ended February 28
(In millions) 2007 2006 2005
Proceeds from new securitizations ............................................ $1,867.5 $1,513.5 $1,260.0
Proceeds from collections reinvested in revolving period
securitizations ........................................................................ $1,011.8 $ 757.5 $ 590.8
Servicing fees received.............................................................. $ 32.0 $ 27.3 $ 24.5
Other cash flows received from the retained interest:
Interest-only strip receivables ................................................ $ 88.4 $ 82.1 $ 79.8
Reserve account releases........................................................ $ 15.2 $ 19.7 $ 14.1
Proceeds from new securitizations. Proceeds from new securitizations include proceeds from receivables that are
newly securitized in or refinanced through the warehouse facility during the indicated period. Balances previously
outstanding in public securitizations that were refinanced through the warehouse facility totaled $82.5 million in