CarMax 2007 Annual Report Download - page 55
Download and view the complete annual report
Please find page 55 of the 2007 CarMax annual report below. You can navigate through the pages in the report by either clicking on the pages listed below, or by using the keyword search tool below to find specific information within the annual report.-
 1
1 -
2
-
3
-
4
-
5
-
6
-
7
-
8
-
9
-
10
-
11
-
12
-
13
-
14
-
15
-
16
-
17
-
18
-
19
-
20
-
21
-
22
-
23
-
24
-
25
-
26
-
27
-
28
-
29
-
30
-
31
-
32
-
33
-
34
-
35
-
36
-
37
-
38
-
39
-
40
-
41
-
42
-
43
-
44
-
 45
45 -
 46
46 -
 47
47 -
 48
48 -
 49
49 -
 50
50 -
 51
51 -
 52
52 -
 53
53 -
 54
54 -
 55
55 -
 56
56 -
 57
57 -
 58
58 -
 59
59 -
 60
60 -
 61
61 -
 62
62 -
 63
63 -
 64
64 -
 65
65 -
66
-
67
-
68
-
69
-
70
-
71
-
72
-
73
-
74
-
75
-
76
-
77
-
78
-
79
-
80
-
81
-
82
-
83
 |
 |

45
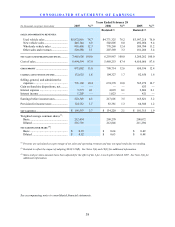
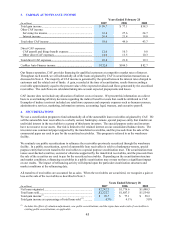
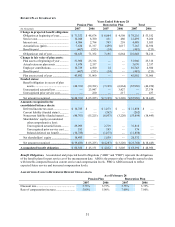
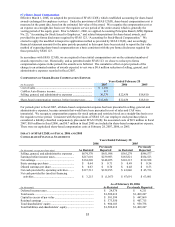
3. CARMAX AUTO FINANCE INCOME
Years Ended February 28
(In millions) 2007 2006 2005
Total gain income ...................................................................... $ 99.7 $ 77.1 $ 58.3
Other CAF income:
Servicing fee income .............................................................. 32.4 27.6 24.7
Interest income ....................................................................... 26.6 21.4 19.0
Total other CAF income ............................................................ 59.0 49.0 43.7
Direct CAF expenses:
CAF payroll and fringe benefit expense................................. 12.0 10.3 9.0
Other direct CAF expenses..................................................... 14.0 11.5 10.3
Total direct CAF expenses......................................................... 26.0 21.8 19.3
CarMax Auto Finance income................................................... $ 132.6 $ 104.3 $ 82.7
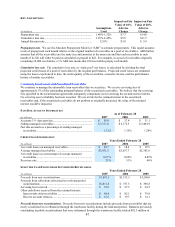
Our finance operation, CAF, provides financing for qualified customers at competitive market rates of interest.
Throughout each month, we sell substantially all of the loans originated by CAF in securitization transactions as
discussed in Note 4. The majority of CAF income is generated by the spread between the interest rates charged to
customers and the related cost of funds. A gain, recorded at the time of securitization, results from recording a
receivable approximately equal to the present value of the expected residual cash flows generated by the securitized
receivables. The cash flows are calculated taking into account expected prepayments and losses.
CAF income does not include any allocation of indirect costs or income. We present this information on a direct
basis to avoid making arbitrary decisions regarding the indirect benefit or costs that could be attributed to CAF.
Examples of indirect costs not included are retail store expenses and corporate expenses such as human resources,
administrative services, marketing, information systems, accounting, legal, treasury, and executive payroll.
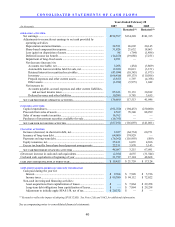
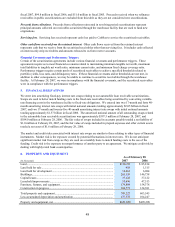
4. SECURITIZATIONS
We use a securitization program to fund substantially all of the automobile loan receivables originated by CAF. We
sell the automobile loan receivables to a wholly owned, bankruptcy-remote, special purpose entity that transfers an
undivided interest in the receivables to a group of third-party investors. The special purpose entity and investors
have no recourse to our assets. Our risk is limited to the retained interest on our consolidated balance sheets. The
investors issue commercial paper supported by the transferred receivables, and the proceeds from the sale of the
commercial paper are used to pay for the securitized receivables. This program is referred to as the warehouse
facility.
We routinely use public securitizations to refinance the receivables previously securitized through the warehouse
facility. In a public securitization, a pool of automobile loan receivables is sold to a bankruptcy-remote, special
purpose entity that in turn transfers the receivables to a special purpose securitization trust. The securitization trust
issues asset-backed securities, secured or otherwise supported by the transferred receivables, and the proceeds from
the sale of the securities are used to pay for the securitized receivables. Depending on the securitization structure
and market conditions, refinancing receivables in a public securitization may or may not have a significant impact
on our results. The impact of refinancing activity will depend upon the particular securitization structures and
market conditions at the refinancing date.
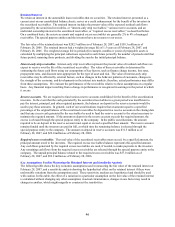
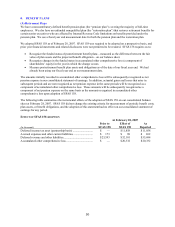
All transfers of receivables are accounted for as sales. When the receivables are securitized, we recognize a gain or
loss on the sale of the receivables as described in Note 3.
Years Ended February 28
(In millions) 2007 2006 2005
Net loans originated................................................................... $ 2,242.3 $ 1,774.6 $ 1,490.3
Total loans sold.......................................................................... $ 2,322.7 $ 1,887.5 $ 1,534.8
Total gain income(1) ................................................................... $ 99.7 $ 77.1 $ 58.3
Total gain income as a percentage of total loans sold (1)............ 4.3% 4.1% 3.8%
(1) Includes the effects of valuation adjustments, new public securitizations, and the repurchase and resale of receivables in
existing public securitizations, as applicable.