CarMax 2007 Annual Report Download - page 35
Download and view the complete annual report
Please find page 35 of the 2007 CarMax annual report below. You can navigate through the pages in the report by either clicking on the pages listed below, or by using the keyword search tool below to find specific information within the annual report.-
 1
1 -
2
-
3
-
4
-
5
-
6
-
7
-
8
-
9
-
10
-
11
-
12
-
13
-
14
-
15
-
16
-
17
-
18
-
19
-
20
-
21
-
22
-
23
-
24
-
 25
25 -
 26
26 -
 27
27 -
 28
28 -
 29
29 -
 30
30 -
 31
31 -
 32
32 -
 33
33 -
 34
34 -
 35
35 -
 36
36 -
 37
37 -
 38
38 -
 39
39 -
 40
40 -
 41
41 -
 42
42 -
 43
43 -
 44
44 -
 45
45 -
46
-
47
-
48
-
49
-
50
-
51
-
52
-
53
-
54
-
55
-
56
-
57
-
58
-
59
-
60
-
61
-
62
-
63
-
64
-
65
-
66
-
67
-
68
-
69
-
70
-
71
-
72
-
73
-
74
-
75
-
76
-
77
-
78
-
79
-
80
-
81
-
82
-
83
 |
 |

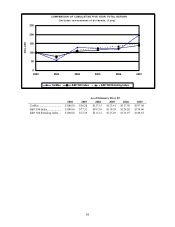
25
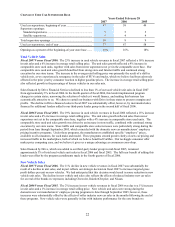
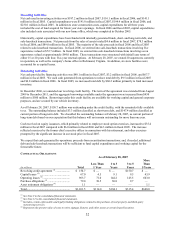
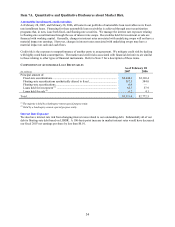
GROSS PROFIT
Years Ended February 28
2007 2006 2005
$ per unit (1) % (2) $ per unit (1) % (2) $ per unit (1) % (2)
Used vehicle gross profit ............... $ 1,903 10.9 $1,808 11.0 $1,817 11.5
New vehicle gross profit................ $ 1,169 4.9 $ 934 3.9 $ 860 3.6
Wholesale vehicle gross profit....... $ 742 16.9 $ 700 16.1 $ 464 12.2
Other gross profit........................... $ 431 66.8 $ 391 58.5 $ 366 55.3
Total gross profit ........................... $ 2,731 13.0 $2,544 12.6 $2,375 12.4
(1) Calculated as category gross profit divided by its respective units sold, except the other and total categories, which are divided
by total retail units sold.
(2) Calculated as a percentage of its respective sales or revenue.
Used Vehicle Gross Profit
We target a similar dollar amount of gross profit per used unit, regardless of retail price. Our ability to quickly
adjust appraisal offers to be consistent with the broader market trade-in trends and our rapid inventory turns reduce
our exposure to the inherent continual depreciation in used vehicle values and contribute to our ability to manage
our gross profit dollars per unit. In addition, over the past few years, we have continued to refine our car-buying
strategies, which we believe has benefited our used vehicle gross profit per unit.
Fiscal 2007 Versus Fiscal 2006. Our used vehicle gross profit increased $95 per unit in fiscal 2007. This increase
reflected the benefit of our strong, consistent sales performance throughout the year. We believe several external
factors contributed to a greater degree of sales volatility in the prior year, including significant changes in gasoline
prices, new vehicle incentives, and interest rates. We did not experience similar variability in these external factors
in fiscal 2007, and therefore benefited from a more stable business environment. We employ a volume-based
strategy, and we systematically mark down individual vehicle prices based on our proprietary pricing algorithms in
order to appropriately balance sales growth, inventory turns, and gross profit achievement. When customer traffic
and our sales are consistently strong, we generally take fewer pricing markdowns, which in turn maximizes our
gross profit dollars per unit. In addition, our used vehicle gross profit in fiscal 2006 was adversely affected by
slowing demand for SUVs and trucks that have lower gas mileage, which resulted in higher pricing markdowns for
these vehicles.
Fiscal 2006 Versus Fiscal 2005. While our used vehicle gross profit dollars per unit in fiscal 2006 was similar to
that achieved in fiscal 2005, our used vehicle gross profits remained under some pressure throughout fiscal 2006.
The profit pressure was primarily the result of the combination of the strong wholesale industry pricing and our
desire to price our retail cars at competitive levels for consumers comparing options in the new and used car
markets. A strong wholesale industry pricing environment increases our cost of acquiring vehicles both in our in-
store purchases and at auction. We were able to offset some of the resulting profit pressure through successful
refinements in our in-store appraisal strategy. During portions of fiscal 2006, we did not increase our appraisal
offers at the same rate as the steep increase in the major public wholesale auction market prices, as we did not
believe the price trends at the major public wholesale auctions were reflective of the broader market trade-in offer
trends. This belief was reinforced by the fact that we continued to experience strong increases in appraisal traffic
while maintaining our ratio of appraisal buys to appraisal offers. This strategy allowed us to keep our retail prices
more in line with underlying retail demand, while maintaining gross profit dollars per unit.
New Vehicle Gross Profit
Fiscal 2007 Versus Fiscal 2006. Our new vehicle gross profit increased $235 per unit in fiscal 2007. The increase
primarily reflected our strategic decision to increase targeted new vehicle gross profit dollars per unit. While this
decision contributed to a reduction in new vehicle unit sales, it resulted in an increase in the total gross profit
contribution from new vehicles.
Fiscal 2006 Versus Fiscal 2005. Our new vehicle gross profit increased $74 per unit in fiscal 2006. The increase
was primarily attributable to the higher profits realized during the domestic new car manufacturers’ employee
pricing programs. We were able to modestly increase our new car prices during these programs, as our pricing had
generally been below the manufacturers’ specified employee discount prices.