CarMax 2007 Annual Report Download - page 34
Download and view the complete annual report
Please find page 34 of the 2007 CarMax annual report below. You can navigate through the pages in the report by either clicking on the pages listed below, or by using the keyword search tool below to find specific information within the annual report.-
 1
1 -
2
-
3
-
4
-
5
-
6
-
7
-
8
-
9
-
10
-
11
-
12
-
13
-
14
-
15
-
16
-
17
-
18
-
19
-
20
-
21
-
22
-
23
-
 24
24 -
 25
25 -
 26
26 -
 27
27 -
 28
28 -
 29
29 -
 30
30 -
 31
31 -
 32
32 -
 33
33 -
 34
34 -
 35
35 -
 36
36 -
 37
37 -
 38
38 -
 39
39 -
 40
40 -
 41
41 -
 42
42 -
 43
43 -
 44
44 -
45
-
46
-
47
-
48
-
49
-
50
-
51
-
52
-
53
-
54
-
55
-
56
-
57
-
58
-
59
-
60
-
61
-
62
-
63
-
64
-
65
-
66
-
67
-
68
-
69
-
70
-
71
-
72
-
73
-
74
-
75
-
76
-
77
-
78
-
79
-
80
-
81
-
82
-
83
 |
 |
24
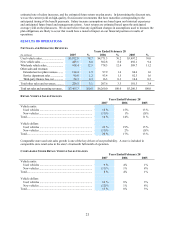
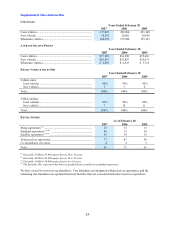
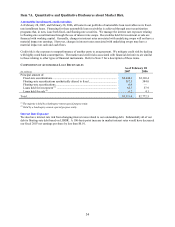
Supplemental Sales Information
UNIT SALES
Years Ended February 28
2007 2006 2005
Used vehicles............................................................................. 337,021 289,888 253,168
New vehicles ............................................................................. 18,563 20,901 20,636
Wholesale vehicles .................................................................... 208,959 179,548 155,393
AVERAGE SELLING PRICES
Years Ended February 28
2007 2006 2005
Used vehicles............................................................................. $ 17,249 $ 16,298 $ 15,663
New vehicles ............................................................................. $ 23,833 $ 23,887 $ 23,671
Wholesale vehicles .................................................................... $ 4,286 $ 4,233 $ 3,712
RETAIL VEHICLE SALES MIX
Years Ended February 28
2007 2006 2005
Vehicle units:
Used vehicles ......................................................................... 95% 93% 92%
New vehicles.......................................................................... 5 7 8
Total........................................................................................... 100% 100% 100%
Vehicle dollars:
Used vehicles ......................................................................... 93% 90% 89%
New vehicles.......................................................................... 7 10 11
Total........................................................................................... 100% 100% 100%
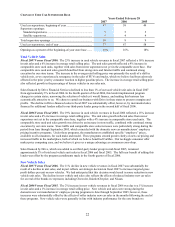
RETAIL STORES
As of February 28
2007 2006 2005
Mega superstores (1) ................................................................... 13 13 13
Standard superstores (2) (4) .......................................................... 40 35 30
Satellite superstores (3) (4) ........................................................... 24 19 15
Total used car superstores.......................................................... 77 67 58
Co-located new car stores 4 4 3
Total........................................................................................... 81 71 61
(1) Generally 70,000 to 95,000 square feet on 20 to 35 acres.
(2) Generally 40,000 to 60,000 square feet on 10 to 25 acres.
(3) Generally 10,000 to 20,000 square feet on 4 to 10 acres.
(4) The Kenosha, Wis. superstore has been reclassified from a satellite to a standard superstore.
We have a total of seven new car franchises. Two franchises are integrated within used car superstores, and the
remaining five franchises are operated from four facilities that are co-located with select used car superstores.