CarMax 2007 Annual Report Download - page 42
Download and view the complete annual report
Please find page 42 of the 2007 CarMax annual report below. You can navigate through the pages in the report by either clicking on the pages listed below, or by using the keyword search tool below to find specific information within the annual report.-
 1
1 -
2
-
3
-
4
-
5
-
6
-
7
-
8
-
9
-
10
-
11
-
12
-
13
-
14
-
15
-
16
-
17
-
18
-
19
-
20
-
21
-
22
-
23
-
24
-
25
-
26
-
27
-
28
-
29
-
30
-
31
-
 32
32 -
 33
33 -
 34
34 -
 35
35 -
 36
36 -
 37
37 -
 38
38 -
 39
39 -
 40
40 -
 41
41 -
 42
42 -
 43
43 -
 44
44 -
 45
45 -
 46
46 -
 47
47 -
 48
48 -
 49
49 -
 50
50 -
 51
51 -
 52
52 -
53
-
54
-
55
-
56
-
57
-
58
-
59
-
60
-
61
-
62
-
63
-
64
-
65
-
66
-
67
-
68
-
69
-
70
-
71
-
72
-
73
-
74
-
75
-
76
-
77
-
78
-
79
-
80
-
81
-
82
-
83
 |
 |

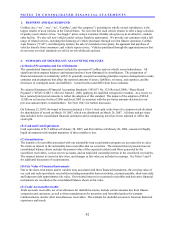
32
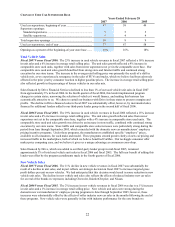
Investing Activities
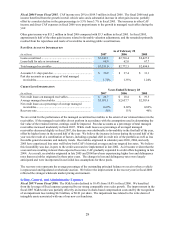
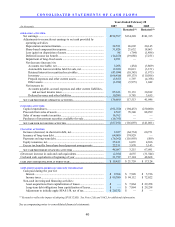
Net cash used in investing activities was $187.2 million in fiscal 2007, $116.1 million in fiscal 2006, and $141.1
million in fiscal 2005. Capital expenditures were $191.8 million in fiscal 2007, $194.4 million in fiscal 2006, and
$230.1 million in fiscal 2005. In addition to store construction costs, capital expenditures for all three years
included the cost of land acquired for future year store openings. In fiscal 2006 and fiscal 2005, capital expenditures
also included costs associated with our new home office, which was completed in October 2005.
Historically, capital expenditures have been funded with internally generated funds, short- and long-term debt, and
sale-leaseback transactions. Net proceeds from the sales of assets totaled $4.6 million in fiscal 2007, $78.3 million
in fiscal 2006, and $89.0 million in fiscal 2005. The majority of the sale proceeds in fiscal 2006 and fiscal 2005
related to sale-leaseback transactions. In fiscal 2006, we entered into sale-leaseback transactions involving five
superstores valued at $72.7 million. In fiscal 2005, we entered into sale-leaseback transactions involving seven
superstores valued at approximately $84.0 million. These transactions were structured with initial lease terms of
either 15 or 20 years with four, five-year renewal options. At February 28, 2007, we owned 20 superstores currently
in operation, as well as the company’ s home office in Richmond, Virginia. In addition, six store facilities were
accounted for as capital leases.
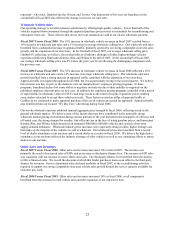
Financing Activities
Net cash provided by financing activities was $48.1 million in fiscal 2007, $3.2 million in fiscal 2006, and $67.7
million in fiscal 2005. We used cash generated from operations to reduce total debt by $9.5 million in fiscal 2007
and $6.8 million in fiscal 2006. In fiscal 2005, we increased total debt by $60.2 million primarily to fund increased
inventory.
In December 2006, we amended our revolving credit facility. The term of the agreement was extended from August
2009 to December 2011, and the aggregate borrowings available under the agreement were increased from $450
million to $500 million. Borrowings under this credit facility are available for working capital and general corporate
purposes, and are secured by our vehicle inventory.
As of February 28, 2007, $150.7 million was outstanding under the credit facility, with the remainder fully available
to us. The outstanding balance included $3.3 million classified as short-term debt, and $147.4 million classified as
current portion of long-term debt. We classified the outstanding balance at February 28, 2007, as current portion of
long-term debt based on our expectation that this balance will not remain outstanding for more than one year.
Cash received on equity issuances, which primarily related to employee stock option exercises, increased to $35.4
million in fiscal 2007 compared with $6.0 million in fiscal 2006 and $4.3 million in fiscal 2005. The increase
reflected exercises by the former chief executive officer in connection with his retirement, and other exercises
prompted by the significant increase in our stock price in fiscal 2007.
We expect that cash generated by operations; proceeds from securitization transactions; and, if needed, additional
debt and sale-leaseback transactions will be sufficient to fund capital expenditures and working capital for the
foreseeable future.
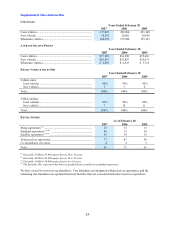
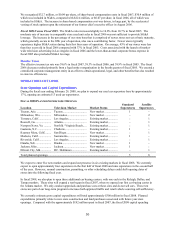
CONTRACTUAL OBLIGATIONS
As of February 28, 2007
(In millions)
Total
Less Than
1 Year
1 to 3
Years
3 to 5
Years
More
Than
5 Years
Revolving credit agreement (1) .................... $ 150.7 $ — $ — $ 150.7 $ —
Capital leases (2) .......................................... 67.0 4.5 9.1 9.5 43.9
Operating leases (2)...................................... 963.7 71.0 144.2 145.5 603.0
Purchase obligations (3) ............................... 79.0 38.5 30.8 9.7 —
Asset retirement obligations (4) 1.1 — — — 1.1
Total............................................................ $1,261.5 $114.0 $184.1 $ 315.4 $ 648.0
(1) See Note 9 to the consolidated financial statements.
(2) See Note 12 to the consolidated financial statements.
(3) Includes certain enforceable and legally binding obligations related to the purchase of real property and third-party
outsourcing services.
(4) Represents the present value of costs to retire signage, fixtures, and other assets at certain leased locations.