CarMax 2002 Annual Report Download - page 97
Download and view the complete annual report
Please find page 97 of the 2002 CarMax annual report below. You can navigate through the pages in the report by either clicking on the pages listed below, or by using the keyword search tool below to find specific information within the annual report.-
 1
1 -
2
-
3
-
4
-
5
-
6
-
7
-
8
-
9
-
10
-
11
-
12
-
13
-
14
-
15
-
16
-
17
-
18
-
19
-
20
-
21
-
22
-
23
-
24
-
25
-
26
-
27
-
28
-
29
-
30
-
31
-
32
-
33
-
34
-
35
-
36
-
37
-
38
-
39
-
40
-
41
-
42
-
43
-
44
-
45
-
46
-
47
-
48
-
49
-
50
-
51
-
52
-
53
-
54
-
55
-
56
-
57
-
58
-
59
-
60
-
61
-
62
-
63
-
64
-
65
-
66
-
67
-
68
-
69
-
70
-
71
-
72
-
73
-
74
-
75
-
76
-
77
-
78
-
79
-
80
-
81
-
82
-
83
-
84
-
85
-
86
-
 87
87 -
 88
88 -
 89
89 -
 90
90 -
 91
91 -
 92
92 -
 93
93 -
 94
94 -
 95
95 -
 96
96 -
 97
97 -
 98
98 -
 99
99 -
 100
100 -
 101
101 -
 102
102 -
 103
103 -
 104
104
 |
 |

95 CIRCUIT CITY STORES, INC. ANNUAL REPORT 2002
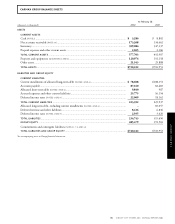
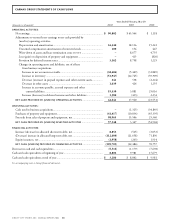
CARMAX GROUP
in fiscal 2002, $44,912,000 (1.8 percent of net sales and oper-
ating revenues) in fiscal 2001 and $48,637,000 (2.4 percent of
net sales and operating revenues) in fiscal 2000.
(B) WRITE-DOWN OF ASSETS AND LEASE TERMINATION COSTS: In the
fourth quarter of fiscal 2001, CarMax recorded $8.7 million for
the write-off of goodwill associated with two underperforming
stand-alone new-car franchises. In the fourth quarter of fiscal
2000, CarMax recorded $4.8 million in charges related to lease
termination costs on undeveloped property and a write-down
of assets associated with excess property for sale. The loss related
to operating leases was calculated based on expected lease termi-
nation costs and costs associated with subleasing the property.
10. SECURITIZATIONS
CarMax has asset securitization programs to finance the automo-
bile loan receivables generated by its finance operation. CarMax’s
finance operation sells its automobile loan receivables to a special
purpose subsidiary, which, in turn, transfers those receivables to a
group of third-party investors. For transfers of receivables that
qualify as sales, CarMax recognizes gains or losses as a component
of the finance operation’s profits, which are recorded as reductions
to selling, general and administrative expenses. A special purpose
subsidiary retains a subordinated interest in the transferred receiv-
ables. CarMax’s finance operation continues to service securitized
receivables for a fee. CarMax’s finance operation refinanced
$641.7 million of automobile loan receivables through the public
issuance of asset-backed securities in fiscal 2002 and $655.4 mil-
lion in fiscal 2001. The automobile loan securitization agreements
do not provide for recourse to the Company for credit losses on
the securitized receivables. Under certain of these securitization
programs, CarMax must meet financial covenants relating to min-
imum tangible net worth, minimum delinquency rates and mini-
mum coverage of rent and interest expense. CarMax was in
compliance with these covenants at February 28, 2002 and 2001.
At February 28, 2002, the total principal amount of auto-
mobile loan receivables managed was $1.55 billion. Of that
total, the principal amount of automobile loan receivables secu-
ritized was $1.54 billion and the principal amount of automo-
bile loan receivables held for sale or investment was $13.9
million. At February 28, 2002, the unused capacity of the auto-
mobile loan variable funding program was $211.0 million. The
aggregate principal amount of automobile loans that were 31
days or more delinquent was $22.3 million at February 28,
2002. The principal amount of losses net of recoveries totaled
$13.2 million for the year ended February 28, 2002, and $7.2
million for the year ended February 28, 2001.
CarMax receives annual servicing fees approximating 1 per-
cent of the outstanding principal balance of the securitized
automobile loan receivables and retains the rights to future cash
flows available after the investors in the asset-backed securities
have received the return for which they contracted. The servic-
ing fees specified in the automobile loan securitization agree-
ments adequately compensate the finance operation for
servicing the securitized receivables. Accordingly, no servicing
asset or liability has been recorded.
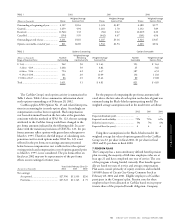
The table below summarizes certain cash flows received from
and paid to the securitization trusts:
Years Ended February 28
(Amounts in thousands) 2002 2001
Proceeds from new securitizations ...................... $752,516 $619,525
Proceeds from collections reinvested in
previous automobile loan securitizations ........ $452,329 $313,827
Servicing fees received ........................................ $ 13,787 $ 10,474
Other cash flows received on
retained interests*.......................................... $ 68,153 $ 39,265
*This amount represents cash flows received from retained interests by the transferor other
than servicing fees, including cash flows from interest-only strips and cash above the mini-
mum required level in cash collateral accounts.
When determining the fair value of retained interests,
CarMax estimates future cash flows using management’s projec-
tions of key factors, such as finance charge income, default
rates, payment rates and discount rates appropriate for the type
of asset and risk. CarMax employs a risk-based pricing strategy
that increases the stated annual percentage rate for accounts
that have a higher predicted risk of default. Accounts with a
lower risk profile may qualify for promotional financing.
Future finance income from securitized automobile loan
receivables that exceeds the contractually specified investor
returns and servicing fees (interest-only strips) is carried at fair
value; amounted to $74.3 million at February 28, 2002, and
$42.0 million at February 28, 2001; and is included in net
accounts receivable. Gains of $56.4 million on sales of automo-
bile loan receivables were recorded in fiscal 2002; gains of $35.4
million on sales of automobile loan receivables were recorded in
fiscal 2001.
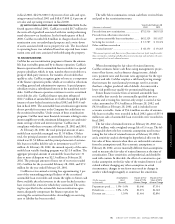
The fair value of retained interests at February 28, 2002, was
$109.0 million, with a weighted-average life of 1.6 years. The fol-
lowing table shows the key economic assumptions used in mea-
suring the fair value of retained interests at February 28, 2002,
and a sensitivity analysis showing the hypothetical effect on the
fair value of those interests when there are unfavorable variations
from the assumptions used. Key economic assumptions at
February 28, 2002, are not materially different from assumptions
used to measure the fair value of retained interests at the time of
securitization. These sensitivities are hypothetical and should be
used with caution. In this table, the effect of a variation in a par-
ticular assumption on the fair value of the retained interest is cal-
culated without changing any other assumption; in actual
circumstances, changes in one factor may result in changes in
another, which might magnify or counteract the sensitivities.
Assumptions Impact on Fair Impact on Fair
(Dollar amounts Used Value of 10% Value of 20%
in thousands) (Annual) Adverse Change Adverse Change
Prepayment speed ....... 1.5%–1.6% $3,646 $7,354
Default rate................. 1.0%–1.2% $2,074 $4,148
Discount rate .............. 12.0% $1,464 $2,896