CarMax 2002 Annual Report Download - page 17
Download and view the complete annual report
Please find page 17 of the 2002 CarMax annual report below. You can navigate through the pages in the report by either clicking on the pages listed below, or by using the keyword search tool below to find specific information within the annual report.-
 1
1 -
2
-
3
-
4
-
5
-
6
-
 7
7 -
 8
8 -
 9
9 -
 10
10 -
 11
11 -
 12
12 -
 13
13 -
 14
14 -
 15
15 -
 16
16 -
 17
17 -
 18
18 -
 19
19 -
 20
20 -
 21
21 -
 22
22 -
 23
23 -
 24
24 -
 25
25 -
 26
26 -
 27
27 -
28
-
29
-
30
-
31
-
32
-
33
-
34
-
35
-
36
-
37
-
38
-
39
-
40
-
41
-
42
-
43
-
44
-
45
-
46
-
47
-
48
-
49
-
50
-
51
-
52
-
53
-
54
-
55
-
56
-
57
-
58
-
59
-
60
-
61
-
62
-
63
-
64
-
65
-
66
-
67
-
68
-
69
-
70
-
71
-
72
-
73
-
74
-
75
-
76
-
77
-
78
-
79
-
80
-
81
-
82
-
83
-
84
-
85
-
86
-
87
-
88
-
89
-
90
-
91
-
92
-
93
-
94
-
95
-
96
-
97
-
98
-
99
-
100
-
101
-
102
-
103
-
104
 |
 |

15 CIRCUIT CITY STORES, INC. ANNUAL REPORT 2002
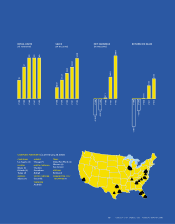
CARMAX MARKETS (as of February 28, 2002)
CALIFORNIA
Los Angeles (3)
FLORIDA
Miami (3)
Orlando (2)
Tampa (2)
GEORGIA
Atlanta (3)
ILLINOIS
Chicago (7)
NORTH CAROLINA
Charlotte
Greensboro
Raleigh
SOUTH CAROLINA
Greenville
TENNESSEE
Nashville
TEXAS
Dallas/Fort Worth (4)
Houston (4)
San Antonio
VIRGINIA
Richmond
WASHINGTON, D.C./
BALTIMORE (5)
FY98
FY99
FY00
FY01
FY02
18
31
40
40
40
RETAIL UNITS
(AT YEAR END)
–3.9%
–1.6%
0.1%
1.8%
2.8%
RETURN ON SALES
–$34.2
–$23.5
$1.1
$45.6
$90.8
NET EARNINGS
(IN MILLIONS)
FY98
FY99
FY00
FY01
FY02
$0.87
$1.47
$2.01
$2.50
$3.20
SALES
(IN BILLIONS)
FY98
FY99
FY00
FY01
FY02
FY98
FY99
FY00
FY01
FY02